Application of MS Live Vaccine (MSH) in Layers
Significant advances in the control of mycoplasmosis have been achieved since the introduction of the mild, effective Mycoplasma gallisepticum vaccine, ts-11, according to a paper by Teruaki Ouchi of Nippon BioLogicals, Inc, Yasuhisa Munakata of Nippon Zenyaku Kogyo Co., Ltd and Hiroshi Sakamoto of Nippon BioLogicals, Inc. 13 June 2008
 14 minute read
 |
| Teruaki Ouchi, Yasuhisa Munakata and Hiroshi Sakamoto. |
However, until recently, disease induced by Mycoplasma synoviae (MS) has remained problematic due to the lack of an effective vaccine. In addition, MS may be contributory to other disease syndromes. For example, recent studies have shown that MS, besides causing production losses on its own, could be a significant factor in initiating E. coli peritonitis, a major cause of mortality in layers. At the 2004 AAAP1 meeting, Dr Kenton Kreager reported that field evidence suggests that the synergy between the two pathogens is a major problem for US layer flocks. Furthermore, experimental study has supported the postulation that a virulent MS strain is a possible primary factor in this syndrome.2
NBI Technology Committee conducted field trial studies for more than one year to determine whether MS live vaccine (MSH) administration would cost-effectively increase production and decrease mortality on large-scale, multiple age, layer farms.
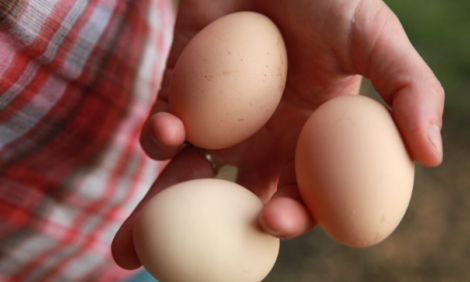
When the field trial production data was assessed, the flocks vaccinated with MS live had significant improvements compared to non-vaccinated flocks previously raised on the same farm. The field trial showed MS live vaccine reduced eggshell top cone abnormalities from 2-4% to zero. (MS is suspected to cause eggshell top cone abnormalities3.) At 57 weeks, the cumulative egg weight was 795g higher in the first study. In the second study at 50 weeks, the cumulative egg weight average was 787g greater. Additionally, there was a reduction of mortality from E. coli peritonitis. From these results, NBI Technological Committee concluded the administration of MS live vaccine is effective and more economical than expected.
Performance of MS Live vaccine on a large-scale layer farm
Study (1)
MS-VACCINATED GROUP: comprised 82,000 Hy-Line Gray (Sonia) commercial layers (4 subgroups or 4 flocks) hatched during the period March-October 2006.
CONTROL GROUP (No MS vaccination): comprised 184,000 Hy-Line Gray (Sonia) commercial layers (9 subgroups or 9 flocks) hatched during the period 2000 to 2005.
In Comparison 1, data from all the commercial layers (no MS vaccination) placed from 2000 to 2005 were used to compare with the MS-vaccinated flocks placed in adjacent time periods.
For Comparison 2, data from the most recently placed non-vaccinated groups derived from the CONTROL GROUP were used (consisting of 82,000 layers: 4 subgroups) for comparative analysis with MS-vaccinated flocks.
Routinely, the pullets are grown MS-free until 120 days of age and thereafter are transferred to the laying house. Almost immediately after transfer, serum agglutination testing was positive for some individuals. By 150 days of age, almost 100% of the layers tested had become MS-positive.
Vaccination programmes:
|
CONTROL GROUP
(No MS live vaccination) |
||
| Age (days) | Vaccines | Route |
|---|---|---|
| 1 | HVT 1.0 dose + CVI 1.0 dose | Subcutaneous |
| 7 | IB (H-120) + ND (Avi) | Eye drop* |
| 15 | IBD | Drinking water |
| 26 | IBD | Drinking water |
| 31 | Mg + IB (H-120) + ND (Avi) | Eye drop* |
| 50 | POX + ILT | Wing web/eye drop |
| 63 | ND (Avi) + IB (C-78) | Drinking water |
| 70 | AE | Drinking water |
| 83 | NB2AC + SE | Intramuscular |
| *Vaccines simultaneously applied by eye drop | ||
|
MS VACCINATED GROUP
|
||
| Age (days) | Vaccines | Route |
|---|---|---|
| 1 | HVT 1.0 dose + CVI 1.0 dose | Subcutaneous |
| 7 | IB (H-120)+ ND (Avi) | Eye drop* |
| 16 | IBD | Drinking water |
| 25 | IBD | Drinking water |
| 31 | Mg + MS + IB (H120) + ND (Avi) | Eye drop* (simultaneous) |
| 45 | POX + ILT | Wing web/eye drop |
| 63 | ND (Avi) + IB (C-78) | Drinking water |
| 70 | AE | Drinking water |
| 87 | NB2AC + SE | Intramuscular |
| *Vaccines simultaneously applied by eye drop | ||
Results
The effect of MS live vaccine was examined by comparing the laying performance of MS-VACCINATED GROUP to the CONTROL GROUP (all 9 subgroups) that was placed into production in all the previous periods 2000-2005. See Table 1.
In order to take into consideration the differences in the time periods that the layers were farmed, the MS-live-vaccinated group was also was compared to only those non-vaccinated layers that were most recently placed into production (4 subgroups hatched 2004-2005). See Table 2
In both analyses, the production data of the MS-vaccinated flocks resulted in significant improvement when compared to the performance of the previous non-vaccinated flocks grown in the same farm.
The following nine parameters were compared:
| 1. | Mortality | 6. | Mean egg weight |
|---|---|---|---|
| 2. | Age at 50% egg production | 7.
|
Cumulative egg production |
| 3. | HD egg production rate | 8. | Feed intake |
| 4. | HH egg production rate | 9. | Feed conversion ratio (FCR) |
| 5. | Normal egg rate |
Each parameter was analyzed by egg production stage:
Stage 1 (early egg production stage: 21- to 35-weeks-old)
Stage 2 (middle egg production stage: 36- to 50-weeks-old)
Stage 3 (late egg production stage: 51- to 65-weeks-old)
With respect to Stage 3, some of the layer subgroups underwent forced-molting at different time periods. The actual comparison of performance parameters included layers only up to 57-weeks-old in order to avoid the differences in the timing of molting in the groups. The data for each parameter are expressed as simple mean value for comparison. The following three tables (Tables 1, 2 and 3) summarize the results of the comparisons.
Comparative Field Study Results
|
Table 1. MS VACCINATED GROUP vs. CONTROL GROUP (all 9 subgroups 2000-2005)
|
||||||||||
| Age at 50% Egg Prod. | Peak Egg Prod. (%) | HD Egg Prod. (%) | HH Egg Prod. (%) | Mortality %/week | Rate of Normal Eggs (%) | Cumulative Egg weight (kg/hen) | Mean Egg weight (g) | Feed Intake (g/hen/day) | FCR | |
|---|---|---|---|---|---|---|---|---|---|---|
| Stage 1 (21-35 wks) | ||||||||||
| MS VACCINE (I) | 148.8 | 94.7 | 85.5 | 84.8 | 0.098 | 97.3 | 5.225 | 57.7 | 102.1 | 1.91 |
| CONTROL (N) | 153.4 | 93.2 | 79.1 | 78.3 | 0.14 | 98.1 | 4.789 | 56.9 | 99.7 | 2.03 |
| Difference (I-N) | -4.7 | 1.5 | 6.4 | 6.5 | -0.042 | -0.8 | -0.8 | 0.8 | 2.3 | -0.12 |
| Stage 2 (36-50 wks) | ||||||||||
| MS VACCINE (I) | - | 87.5 | 85.4 | 0.163 | 97.7 | 10.913 | 63.4 | 104.4 | 1.88 | |
| CONTROL (N) | - | 84.7 | 81.7 | 0.192 | 98 | 10.2 | 63.2 | 107.7 | 2.02 | |
| Difference (I-N) | - | 2.8 | 3.7 | -0.029 | -0.4 | 0.712 | 0.2 | -3.3 | -0.13 | |
| Stage 3 (51-57 wks) | ||||||||||
| MS VACCINE (I) | 80.8 | 76.7 | 0.256 | 98.5 | 13.362 | 64.3 | 105.9 | 2.04 | ||
| CONTROL (N) | 78.7 | 73.8 | 0.257 | 95.9 | 12.567 | 64.5 | 109.5 | 2.16 | ||
| Difference (I-N) | 2.2 | 2.9 | -0.001 | 2.6 | 0.795 | -0.2 | -3.6 | -0.11 | ||
| (Nov. 29, 2007, TO) | ||||||||||
Comparison 1
Table 1 compares the CONTROL GROUP (no MS vaccine), consisting of all 9 subgroups placed into production from 2000 to 2005 and MS-VACCINATED GROUP, consisting of 4 subgroups placed into production March – Oct 2006.
There were marked differences in the MS-VACCINATED GROUP:
- They sexually matured 4.7 days earlier (age at 50% egg production was 4.7 days younger).
- The peak egg production rate was 1.5% higher.
- The HD egg production rate was 6.4, 2.8 and 2.2% greater for Stage 1, 2 and 3, respectively.
- The HH egg production rate was 6.5, 3.7 and 2.9% greater for Stage 1, 2 and 3, respectively.
- The Mortality during Stage 1 was 0.042%/week lower (0.68%/15 weeks) and during Stage 2 was 0.029% lower (0.44%/15 weeks) compared with the control group. There was no significant difference between the groups with respect to mortality during Stage 3.
- Cumulative egg weight (57 weeks) was 795g more.
- The overall feed conversion ratio was 0.13% better.
- Feed intake was 2.3 grams greater during stage 1. During stage 2, it was 3.3g less and during stage 3, it was 3.6g less. These results suggest that the greater feed intake in Stage 1 supports stable egg production.
|
Table 2: MS VACCINATED GROUP versus CONTROL GROUP (4 subgroups)
|
||||||||||
| Age at 50% Egg Prod. | Peak Egg Prod. (%) | HD Egg Prod. (%) | HH Egg Prod. (%) | Mortality %/week | Rate of Normal Eggs (%) | Cumulative Egg weight (kg/hen) | Mean Egg weight (g) | Feed Intake (g/hen/day) | FCR | |
|---|---|---|---|---|---|---|---|---|---|---|
| Stage 1 (21-35 wks) | ||||||||||
| MS VACCINE (I) | 148.8 | 94.7 | 85.5 | 84.8 | 0.098 | 97.3 | 5.225 | 57.7 | 102.1 | 1.91 |
| CONTROL (N) | 157.8 | 93.1 | 75.6 | 74.9 | 0.134 | 97.8 | 4.65 | 57.3 | 96.4 | 2.01 |
| Difference (I-N) | -9.0 | 1.6 | 9.9 | 9.8 | -0.036 | -0.5 | 0.575 | 0.5 | 5.6 | -0.10 |
| Stage 2 (36-50 wks) | ||||||||||
| MS VACCINE (I) | - | 87.5 | 85.4 | 0.163 | 97.7 | 10.913 | 63.4 | 104.4 | 1.88 | |
| CONTROL (N) | - | 85.4 | 82.7 | 0.175 | 97.6 | 10.15 | 63.7 | 104.5 | 1.93 | |
| Difference (I-N) | - | 2.1 | 2.7 | -0.013 | 0.1 | 0.763 | -0.3 | -0.2 | -0.04 | |
| Stage 3 (51-57 wks) | ||||||||||
| MS VACCINE (I) | 80.8 | 76.7 | 0.256 | 98.5 | 13.362 | 64.3 | 105.9 | 2.04 | ||
| CONTROL (N) | 79.4 | 74.8 | 0.289 | 95.2 | 12.575 | 64.8 | 109.4 | 2.12 | ||
| Difference (I-N) | 1.4 | 1.8 | -0.033 | 3.3 | 0.787 | -0.5 | -3.5 | -0.08 | ||
| (Nov. 29, 2007, TO) | ||||||||||
Comparison 2
Table 2 compares the same parameters between the MS-VACCINATED GROUP and the CONTROL GROUP (the 4 subgroups most recently placed during 2004-2005, totalling 82,000 layers).
There were marked differences in the MS-VACCINATED GROUP:
- The time to 50% egg production was 9 days earlier. This advantage was partly due to the fact that the layers in two subgroups of the CONTROL GRUOP (no-vaccine subgroups) did not begin laying eggs until extremely late. However, even when these groups were excluded from the analysis, the difference was still 5.2 days.
- The peak egg production rate was 1.6% higher.
- The HD egg production rate was 9.9, 2.1 and 1.4% greater for Stage 1, 2 and 3, respectively.
- The HH egg production rate was 9.8, 2.7 and 1.8% greater for Stage 1, 2 and 3, respectively.
- The Mortality;
Stage 1 was 0.036%/week lower (0.57%/15 weeks),
Stage 2 was 0.013% lower (0.2%/15 weeks),
Stage 3 was 0.033% lower (0.5%/7 weeks).
Technicians investigated all deaths with postmortem. The analysis of the data suggests the lower mortality observed was attributable to fewer cases of E. coli peritonitis in MS-vaccinated groups. - Cumulative egg weight (57 weeks) was 787g more.
- The feed conversion ratio was 0.1% lower during Stage 1. However, the overall difference was 0.07%; thus, there was almost no significant difference between the groups.
- Feed intake was 5.6g more during Stage 1. However, there was almost no difference during Stage 2. In Stage 3, it was 3.5g less. These results suggest that greater feed intake in Stage 1 supports stable egg production.
Age and egg production immediately prior to forced molting
|
Table 3: Comparisons of age and egg production rate at the forced molting
|
|||||
| Subgroup No. | Age at forced molting (weeks) | Egg production rate at forced molting (%) | Mean Egg production rate before forced moulting (%) ** | Substandard Eggs (%)* | |
|---|---|---|---|---|---|
| CONTROL GROUP No vaccine |
00531 | 65 | 78.7 | 86.1 | 0.9 |
| 20907 | 56 | 79.6 | 83.4 | 1.5 | |
| 30405 | 57 | 76.6 | 81.8 | 1.9 | |
| 30619 | 62 | 77.4 | 82.5 | 3.7 | |
| 30827 | 60 | 74.2 | 83.3 | 2.6 | |
| 40610 | 58 | 75.5 | 82.5 | 2.7 | |
| 41030 | 66 | 78.7 | 84.7 | 6.0 | |
| 50323 | 62 | 75.3 | 82.5 | 10.0 | |
| 50604 | 64 | 78.3 | 85.0 | 12.9 | |
| Mean (2000-2005) | 61.1 | 77.1 | 83.5 | 4.7 | |
| Mean (2004-2005) | 62.5 | 77.0 | 83.7 | 7.9 | |
| MS Live vaccine Group | 60321 | 64 | 72.3 | 83.0 | 2.4 |
| 60531 | 67 | 79.4 | 86.7 | 2.3 | |
| 60812 | 68 | 79 | 86.3 | 2.7 | |
| Mean (March-Oct 2006) | 66.3 | 76.9 | 85.3 | 2.5 | |
| * % are taken before grade and packaging (Dec 2, 2007, T.O) ** Average egg production rate from 50% of flock producing eggs until just before moulting |
|||||
Table 3 shows age (weeks) at the time of forced moulting. The age at forced molt varied greatly. However, the mean time for the MS-VACCINATED GROUP was 5.2 weeks later than the CONTROL GROUP (aggregate data, all subgroups combined 2000-2005) and 3.8 weeks later than that in the 4 subgroups (2004-2005).
In particular, forced moulting in the MS-VACCINATED GROUP was four weeks later than in the CONTROL GROUP (9 subgroups, 2000-2005). Nevertheless, the egg production rate was similar at the time of moulting for both, even though the vaccinated group was able to sustain a longer period of good production. This finding suggests that laying persistency improved dramatically due to vaccination with MS live vaccine.
Summary
Based on the data collected in these studies, the effect of the MS live vaccine on improved laying performance contributes to considerable increase in revenue.
The benefits of the vaccine are as follows:
- Prevents delay of egg production (promotes normal sexual development)
- Decreases mortality
- Improves egg production rate
- Improves laying persistency (maintains egg production rate in the late egg production stage)
- Reduces under-grade eggs in the late egg production stage (improves eggshell quality)
- Increases cumulative egg production
- Improves feed conversion ratio
The MS live vaccine tended to increase egg weight rapidly during the early egg production stage, while reducing it during the late egg production stage due to improved laying persistency. Thus, it appears the vaccine greatly improved egg quality.
Economic benefit
Hen-housed (HH) cumulative egg production is considered the best indicator of the economic benefit gained from use of the vaccine. The HH cumulative egg production to 57 weeks was approximately 800g more for the vaccinated group. This difference is equivalent to approximately 13 eggs, which is conservatively estimated to represent a net profit of about 100 yen. This extra income comfortably covers the cost of the MS live vaccine. The feed conversion ratio was better in the MS live vaccine group by approximately 7%, compared to all 9 flocks of control groups. This savings amounts to a 120-yen reduction in the cost of feed per hen (assuming that the hens are fed up to 78 weeks). The cost reductions cannot be ignored in view of the current high price of feed.
Performance of MS live vaccine on a large-scale layer farm
Study (2)
The economic effect of the MS live vaccine was examined by comparing the laying performance of the following:
MS-VACCINATED GROUP: comprised 315,000 Lohmann (Julia-LSL) commercial layers (9 subgroups) that were placed during the period April 2006 to February 2007 and vaccinated with MS live vaccine (MSH) and Mg live vaccine (ts-11)
CONTROL GROUP: comprised 245,000 Lohmann (Julia-LSL) commercial layers (7 subgroups) that were placed prior to the above period and vaccinated with only Mg live vaccine (ts-11).
Vaccination programmes were the same as described earlier.
The study was conducted at a farm that maintains an egg production rate greater than 90% for approximately 20 weeks, followed by a period in which the egg production rate was relatively stable and good. However, after the layers are transferred to the adult layer house (at 150 to 190 days), they become 100% sero-positive for MS. The farmer suspects that MS is negatively influencing the duration of the 90% egg-production rate and increasing the mortality during the second half of the laying period. Therefore, the farmer conducted this study to determine whether the live MS live vaccine would improve these parameters.
Performance comparisons were made between flocks vaccinated with: (A) Mg-live-vaccine (ts-11) only and (B) the flocks that received both the live MS live vaccine and Mg live vaccine. The MS live vaccinated flocks had a period of 90% egg production rate that was approximately 10 weeks longer, and the egg production rate after 50 weeks was 5% better (an improvement of 7 eggs per hen).
The effect of the MS live vaccine on laying performance
|
Interim results of vaccination study on a large-scale farm (Nov. 2007)
|
|||||
| Age at 50% Egg Production | Peak Egg Production (%) | No. of Weeks in which Egg Prod. was >90 % | Mean Egg Prod. (%) | Mortality (%/week) | |
|---|---|---|---|---|---|
| Stage 1 (21-35 wks) | |||||
| MS VACCINE (I) | 143.7 | 93.8 | 12 | 87.1 | 0.082 |
| CONTROL (N) | 142.6 | 93.7 | 12 | 87.7 | 0.074 |
| Difference (I–N) | 1.1 | 0.1 | 0 | –0.6 | 0.008 |
|
Stage 2 (36-50 wks) |
|||||
| MS VACCINE (I) | 15 | 92.7 | 0.153 | ||
| CONTROL (N) | 10 | 91.2 | 0.168 | ||
| Difference (I–N) | 5 | 1.5 | –0.015 | ||
| Stage 3 (51-57 wks) | |||||
| MS VACCINE (I) | 5 | 90.1 | 0.199 | ||
| CONTROL (N) | 0 | 85.1 | 0.197 | ||
| Difference (I–N) | 5 | 5 | 0.002 | ||
| *Control group: 245,000 layers (7 subgroups, first started May to November 2005) (Dec 5, 2007, T.O) | |||||
Summary
 |
| Figure 1: Example of eggshell top cone abnormality |
This farm has historically performed well due to good management and hygiene control. However, administration of the live MS vaccine produced significant improvement for the duration of the high egg production period.
* The period in which the egg production rate was greater than 90% was extended by 10 additional weeks.
* The egg production rate in layers aged 50 weeks or more improved by 5% (106%).
The economic benefit due to these improvements was significant. (Increased more than 7 eggs/hen)
Conclusion
In two large-scale field trials, flocks vaccinated with the live MS vaccine, MSH, consistently performed better than unvaccinated flocks when a number of parameters were considered. The actual benefits of using MSH in other commercial settings in the future might vary from farm to farm, depending upon such factors as management practices, concurrent disease, and severity of wild MS field challenge, However, the current studies provide strong evidence that MSH will easily prove to be economically justified in today’s competitive layer industry.
References
Symposium on Emerging & Re-emerging Diseases. AAAP meeting, July 25, 2004 Philadelphia, PA. Ziv Raviv, N. Ferguson-Noel, V. Laidinis, R Wooten, and S.H. Kleven. Role of Mycoplasma synoviae in commercial layer Escherichia coliperitonitis syndrome. Avian Diseases 51:685-690. 2007. Ferberwee A., J. de Wit, and W. Landman. Mycoplasma synoviae – associated apex abnormalities. The 15th Congress & Exhibition of the World Veterinary Poultry Association, Sept. 10-15, 2007 Beijing China, pg.234. ts-11 (live Mg) vaccine and MSH (live MS) vaccine manufactured by Bioproperties, Australia under the trademarks Vaxsafe MG and Vaxsafe MSMay 2008