

Energy Use and Costs at an Applied Broiler Research Farm
By G. Tom Tabler, Frank T. Jones and Walter G. Bottje, University of Arkansas Division of Agriculture. Published in Avian Advice Spring 2008 Volume 10, Number 1. Gas and electricity prices paid since renovation in 2007 are the highest in the farm's history but the authors believe the bottom line may have been worse if the broiler houses had not been upgraded.High energy costs continue to cause concern for poultry producers across the country. Currently, both integrators and producers are faced with increasing production costs, making normal operations more difficult. A number of farms, including the Applied Broiler Research Farm (ABRF), have recently been renovated in an effort to become more energy-efficient and remain competitive. However, high energy costs have prompted many producers to wonder if renovations are paying off.
| More on the Authors | |
| Dr. Frank Jones Extension Section Leader |
|
Energy Use
The ABRF placed its first flock of birds in November 1990 and sent birds to processing in January 1991. The farm has always heated with propane. The data in Figure 1 show that propane prices averaged about $0.56/gallon prior to 2000. Propane prices rose an average of about $0.13/gal between 2001 and 2007 and are currently at $2.04/gallon.
Figure 1. Average ABRF Propane Prices
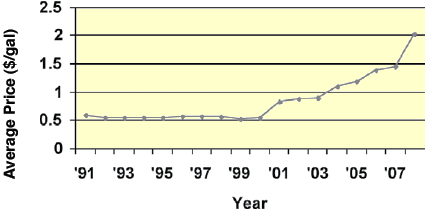
Figure 2. Propane use at the ABRF between 1991 and 2007
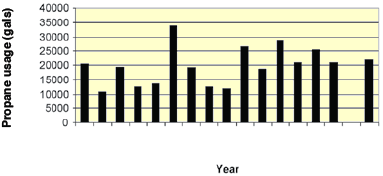
Figure 2 illustrates annual farm propane usage from 1991 through 2007. Data are not reported for 2006 because the farm was undergoing renovation from between January and April 2006, thereby missing most of the cold weather that year. While the most propane consumed in any one year (33,800 gallons) was in 1996, an average of about 17,000 gallons was used between 1991 and 1997. Propane usage between 2000 and 2005 has averaged slightly over 23,350 gallons. This increase in usage was likely due to air leaks in the houses and curtains (which were getting older) and brooding chicks at warmer temperatures compared to earlier years. Gas usage for 2007 (the only full year since the renovation) was 22,100 gallons.
So has the ABRF used less gas since the renovation? With 16 years of before-renovation data but only one full year of data since the renovation, it is difficult to predict the long-term effect of renovation on propane usage. However, the total usage in 2007 appears to be slightly lower than the average usage for the previous six years since 2000.
Figure 3. Electricity use at the ABRF between 1991 and 2007
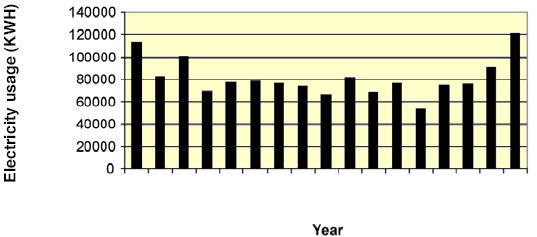
Annual ABRF electricity use data are shown in Figure 3. After the initial three years of operation (1991-1993), electrical usage averaged about 75,000 kilowatt hours (kWh) annually until 2006. When the farm was renovated, it went from four curtain-sided houses that were able to take advantage of both natural ventilation and natural daylight, to four solid sidewall, tunnel-ventilated houses that required power ventilation (fans) and artificial light, both day and night.
Electricity usage was expected to increase after the renovation and it did. After renovations, 2006 (a partial year running from April through December) used 90,941kWh, while the full year of 2007 used 120,681kWh. There is now better control of in-house conditions, providing a more uniform environment for the birds, but it comes with an increase in electricity usage and cost.
So is the farm saving on electricity use since the renovation? No, actually more kilowatt hours have been used since the renovation than before. However, our performance data suggest that the extra electricity did improve the environment for growing birds, resulting in better bird performance and a consistently higher income (Tabler, 2007).
Figure 4. Propane costs at the ABRF between 1991 and 2007
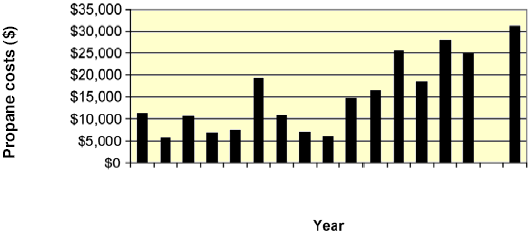
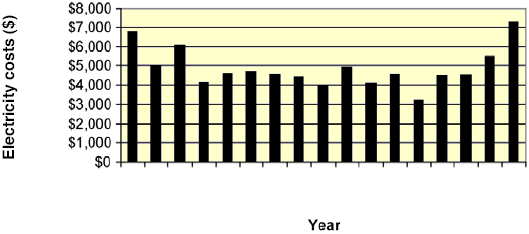
Figure 5. Electricity costs at the ABRF between 1991 and 2007
Energy Costs
Annual costs for both propane and electricity have increased since renovation (Figures 4 and 5) and 2007 costs for electricity and propane were the highest ever in the history of ABRF. Yet the reason for high propane costs was due to increased propane prices (Figure 1), while the reason for high electricity costs was increased usage rates and not elevated prices (Figure 3).
Even though every integrator and every complex does things somewhat differently, most integrators have modified their broiler contracts to offer pay increases as an incentive to producers who renovate their farms. Some may also offer assistance with ammonia control products, bedding or fuel allowance as an added incentive. However, after the energy bills were paid, did we have more of the settlement check [income when the birds had been sold] after renovations than before?
Energy Costs and the Settlement Check
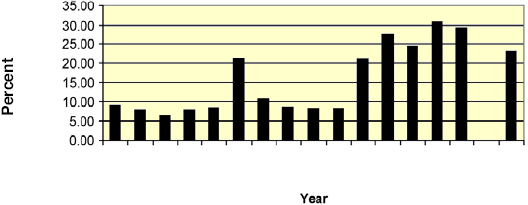
The average annual propane cost as a percentage of the settlement check at the ABRF is shown in Figure 6. During the period 1991 through 2000, propane costs were almost always less than 10% of the check but between 2001 and 2005, these costs amounted to more than 20% of the check, reaching a peak of 30.92% in 2004. In 2007 (after renovations), propane costs as a percentage of the settlement check were the lowest (23%) since 2001.
Figure 6. Historical annual gas costs as a percentage of the settlement check at ABRF
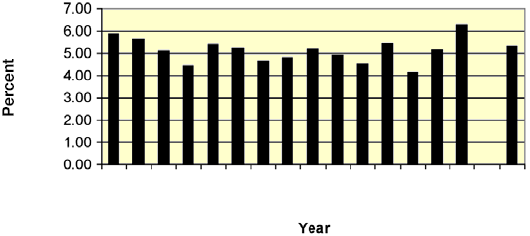
Electricity costs as a percentage of the settlement check have remained fairly constant throughout the history of the farm (usually about 5±1%) (Figure 7). Electricity cost as a percentage of the settlement check was 5.32% in 2007, similar to costs incurred during most years before renovation.
Figure 7. Historical annual electricity costs as a percentage of settlement check at ABRF
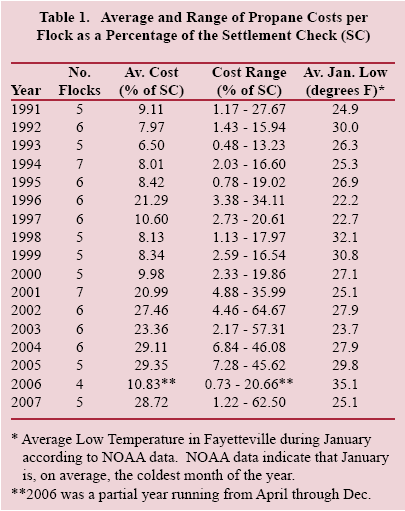
Average propane cost data in Table 1 show the same dramatic increase in energy costs seen in Figure 6. However, since the ABRF uses each settlement check to pay production costs, average data are sometimes inadequate. The table also contains the range of propane costs by flock and average January low temperature data obtained from NOAA. Since on average January is the coldest month of the year, temperature data were included to gauge the influence of atmospheric temperature on propane costs.
On average, maximum propane costs before 2000 were 20.18% of the settlement checks, while after 2000 peak propane costs averaged 47.43%. Correlations between maximum propane costs and low temperatures prior to 2000 show a coefficient of -0.60, while similar correlations after 2000 show a coefficient of -0.16.
These analyses suggest that low temperatures likely had a large effect on high energy costs prior to 2000, while price appeared to be the primary influencer after 2000. These data also suggest that had the ABRF not anticipated elevated energy costs, major cash flow difficulties could have arisen.
Conclusions
While these data give some indication of energy use and cost before and after broiler farm renovation, they only reflect conditions at ABRF, which is on one site in north-west Arkansas. It would be difficult to transfer these figures anywhere else with any degree of certainty. A farm across the road, across the state, or across the country would likely report different information than that presented here.
Granted, the ABRF is designed to be a typical four-house commercial broiler farm similar to thousands of others across Arkansas and the US. However, it is also unique, as is every other farm, in terms of its location, topography, elevation, geographical setting, wind currents, airflow patterns, other climate factors and local energy costs.
Energy use is also affected by the management program of the farm’s integrator and how each grower applies the program. Therefore, it is important to understand the limitations of these data. The data represent one broiler farm and should be taken as such.
Summary
High propane prices have poultry producers struggling to keep their farms in operation. Some are questioning whether recent expensive renovations are saving or costing money. Every operation is unique, making that a difficult question to answer. It depends on each individual producer’s unique situation (farm location, energy costs, integrator incentives and management style).
During 2007, the ABRF paid the highest price in the farm’s history for both gas and electricity. However, integrator incentives to renovate offset some of those higher costs. Electricity cost increased from 5.04% to 5.26% while gas cost decreased from 26.34% to 21.77% of the settlement check after renovation compared to the previous 5-year period. Limited data exists for the post-renovation period and these figures will likely change with time. Caution should be taken not to read more into the data than is actually there at this early stage.
August 2008


