

Highlights of Structure of the US Poultry Industry, 2010
A description of the interactions among poultry industry segments, based on a study conducted by the USDA National Animal Health Monitoring System (NAHMS) as part of its Poultry 2010 study.The USDA's National Animal Health Monitoring System (NAHMS) conducted the Poultry 2010 study. One objective of the study was to describe the structure of commercial poultry industries, including interactions among poultry industry segments, movements and biosecurity practices. An understanding of the industry structure is important for managing disease outbreaks.
The Poultry 2010 study was administered to the nation's largest broiler, turkey, table-egg layer and breeder companies1, accounting for over 70 per cent of their respective industries. Estimates in this information sheet reflect the practices of these large companies only.
1 Turkey primary breeder companies were not included in the study.
General Industry Structure
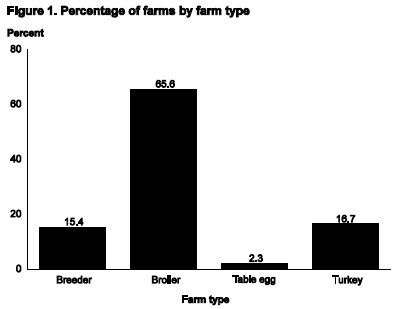
Nearly two-thirds of farms (65.6 per cent) were broiler farms. Table-egg production farms accounted for 2.3 per cent of farms. Turkey farms accounted for 16.7 per cent of farms and breeder farms accounted for 15.4 per cent of farms (Figure 1).
Broiler companies had a median of 464 farms, whereas table-egg companies had a median of eight farms.
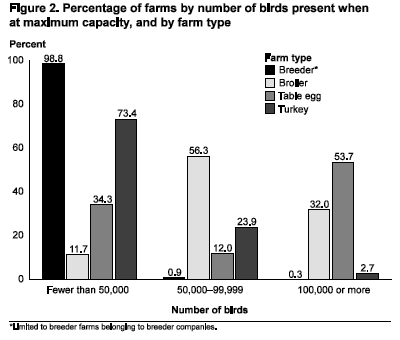
Nearly all breeder farms (98.8 per cent) and three-quarters of turkey farms (73.4 per cent) had fewer than 50,000 birds at maximum capacity. The majority of broiler farms (56.3 per cent) had 50,000 to 99,999 birds, and the majority of table-egg farms (53.7 per cent) had 100,000 or more birds (Figure 2).
Breeder Farms
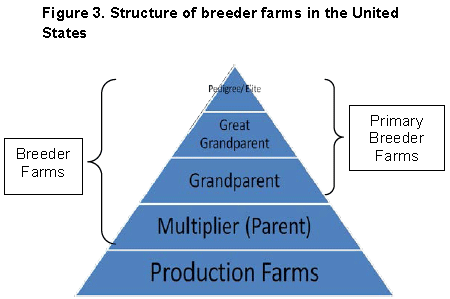
Poultry production begins with primary breeders – the genetic stock for the industry. Primary breeder flocks consist of pedigree (elite/foundation), great-grandparent and grandparent birds. Grandparent flocks produce the final generation of breeding birds (multiplier (parent) flocks). Eggs from multiplier flocks hatch to become production birds (broilers, market turkeys, table-egg layers) for human consumption (Figure 3).
As suppliers of industry genetics, primary breeder farms commonly shipped eggs outside of their State (74.9 per cent of farms) as well as outside of the United States (56.8 per cent of farms). Multiplier farms mostly shipped eggs within the State (95.2 per cent of farms).
Hatchery ownership differed by production type. Nearly all hatcheries that provided chicks to broiler farms (92.2 per cent) were owned by the production company; less than three per cent of hatcheries that supplied table-egg production farms were owned by the production company.
Hatcheries belonging to broiler and turkey production companies mostly produced chicks/poults to supply their companies only (92.0 and 63.6 per cent of hatcheries, respectively). As producers of the genetics for the rest of the industry, 80.0 per cent of primary breeder hatcheries supplied other companies.
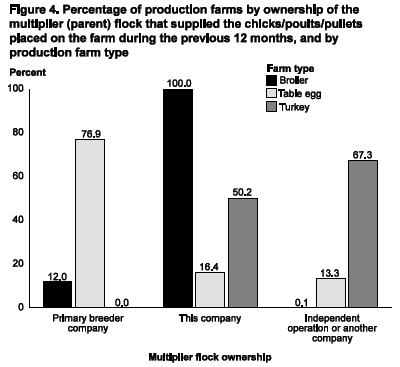
Ownership of multiplier flocks differed by production type. All broiler farms received chicks produced by company-owned multiplier flocks. Pullets placed on the majority of table-egg farms (76.9 per cent) were produced by multiplier flocks owned by a primary breeder company. Birds placed on the majority of turkey-production farms (67.3 per cent) were produced by multiplier flocks owned by an independent operator or another company (Figure 4).
Production Farms
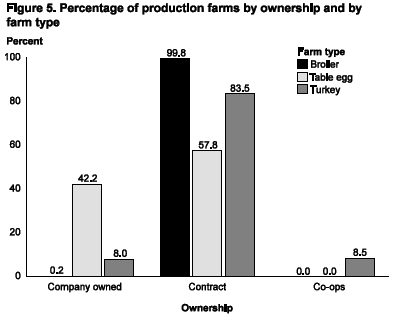
A higher percentage of table-egg farms than broiler or turkey farms were company owned (42.2 versus 0.2 and 8.0 per cent of farms, respectively; Figure 5).
Over eight out of 10 turkey-grower farms (82.8 per cent) had toms only; 0.8 per cent had both hens and toms. About four of 10 turkey-grower farms also had brood birds on the same farm (43.4 per cent). Organic farming was most common in table-egg production; 11.2 per cent of table-egg farms had at least one house designated as organic.
Table-egg farms most commonly raised pullets on a separate farm belonging to the same company (86.6 per cent of table egg farms) and located within the same State as the farm (77.0 per cent of table egg farms).
About eight of 10 table-egg farms (87.5 per cent) collected eggs by belt only.
About eight of 10 table-egg farms (82.4 per cent) primarily produced shell eggs, while 17.6 per cent primarily produced eggs for breaking.
Of farms that primarily produced shell eggs, about one-third had on-farm egg processing facilities and two-thirds sent eggs off-farm for processing. About one-half of farms with on-farm processing (45.3 per cent) processed eggs for other farms.
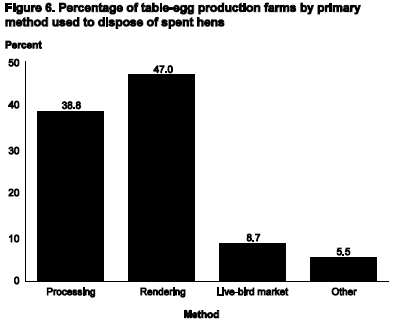
About one-half of table-egg farms (54.6 per cent) moulted their last completed flock. Moulted flocks were kept in the laying house an average of 88.7 weeks and nonmolted flocks an average of 64.2 weeks. The most common methods of disposal of spent hens were rendering and processing (47.0 and 38.8 per cent of farms, respectively; Figure 6).
On average, broilers were marketed or slaughtered at 7.2 weeks of age, turkey hens at 14.2 weeks of age, and turkey toms at 19.7 weeks of age.
No broiler or turkey farms marketed birds via a live-bird market.
All broiler slaughter facilities and three-quarters of the turkey slaughter facilities (77.3 per cent) that slaughtered birds for the participating companies were owned by their respective production companies. None of the slaughter facilities slaughtered other species of poultry or other species besides poultry.
October 2012


