GLOBAL POULTRY TRENDS - Chicken Production Outside the EU is Much Faster Than Within
In Europe, non-European Union countries have expanded chicken meat production at six times the rate of EU member states since 2000, writes industry analyst Terry Evans. 4 November 2015
 9 minute read
 By:
By: Reference to Table 1 reveals that between 2000 and 2013 chicken meat output in Europe grew at 4.2 per cent per year climbing from 9.5 million tonnes to 16.1 million tonnes, while the global figure rose by a little under 4 per cent per year from 58.7 million tonnes to 96.3 million tonnes.
| Table 1. Indigenous* chicken meat production (million tonnes) | ||||||||||||
| Region | 2000 | 2005 | 2006 | 2007 | 2008 | 2009 | 2010 | 2011 | 2012 | 2013 | 2014E | 2015F |
|---|---|---|---|---|---|---|---|---|---|---|---|---|
| Americas | 27.1 | 32.7 | 33.7 | 35.0 | 37.5 | 36.9 | 38.8 | 40.0 | 40.5 | 42.1 | 42.8 | 43.4 |
| Asia | 18.6 | 22.4 | 23.5 | 25.0 | 26.2 | 28.0 | 29.2 | 30.3 | 31.6 | 32.2 | 32.1 | 32.7 |
| Europe | 9.5 | 10.9 | 10.8 | 11.6 | 12.1 | 13.3 | 13.9 | 14.6 | 15.5 | 16.1 | 16.5 | 16.7 |
| Oceania | 0.7 | 0.9 | 1.0 | 1.0 | 1.0 | 1.0 | 1.1 | 1.2 | 1.2 | 1.3 | 1.2 | 1.3 |
| WORLD | 58.7 | 70.3 | 72.3 | 76.2 | 80.7 | 83.4 | 87.4 | 90.6 | 93.3 | 96.3 | 97.5 | 99.0 |
| Broiler meat production (million tonnes) | ||||||||||||
| WORLD | 50.1 | 63.1 | 64.3 | 68.3 | 72.8 | 73.6 | 78.2 | 81.4 | 83.4 | 84.6 | 86.4 | 87.3 |
| *Meat from the slaughter of birds originating in a country, plus the meat equivalent of any such birds exported live. | ||||||||||||
| E 2014 and F 2015 author's estimates and forecasts for chicken meat, F 2015 USDA forecast for broiler meat. | ||||||||||||
| Regional figures may not add up to the world totals due to rounding. | ||||||||||||
| Sources: FAO for chicken meat, USDA for broiler meat. | ||||||||||||
Thus, during this period, Europe’s share of the world total increased from 16.2 to 16.7 per cent. This figure could come close to 17 per cent this year.
A close look at the data for Europe (Table 2) shows that while production in the EU during this period expanded by 2.1 per cent per year or 2.6 million tonnes from 8.3 million tonnes to 10.9 million tonnes, output in non-EU European countries jumped by a massive 12 per cent per year from 1.2 million tonnes to 5.2 million tonnes.
| Indigenous chicken meat production in Europe ('000 tonnes eviscerated weight) | |||||||
| Country | 2000 | 2005 | 2009 | 2010 | 2011 | 2012 | 2013 |
|---|---|---|---|---|---|---|---|
| Albania | 2.6 | 6.9 | 10.5 | 11.2 | 11.9 | 10.8 | 15.8 |
| Austria | 83.5 | 82.7 | 98.2 | 104.4 | 111.8 | 106.8 | 107.5 |
| Belarus | 76.1 | 89.5 | 203.1 | 243.2 | 279.8 | 333.9 | 365.1 |
| Belgium | 315.3 | 313.0 | 264.3 | 288.3 | 362.2 | 362.2 | 362.2 |
| Bosnia/Herzegovina | 3.6 | 8.4 | 31.1 | 36.5 | 44.0 | 52.1 | 40.7 |
| Bulgaria | 104.4 | 75.8 | 128.9 | 111.0 | 107.0 | 111.9 | 102.5 |
| Croatia | 23.9 | 30.3 | 30.3 | 23.2 | 29.5 | 28.7 | 26.1 |
| Czech Rep | 230.0 | 230.0 | 291.1 | 286.9 | 275.4 | 259.8 | 254.9 |
| Denmark | 187.0 | 182.0 | 168.0 | 186.0 | 186.2 | 187.0 | 168.0 |
| Estonia | 7.6 | 12.8 | 14.2 | 14.2 | 14.8 | 15.3 | 16.9 |
| Finland | 65.4 | 87.6 | 97.4 | 89.6 | 95.3 | 101.0 | 105.4 |
| France | 1273.0 | 1165.0 | 1113.8 | 1160.0 | 1160.0 | 1178.6 | 1205.6 |
| Germany | 586.9 | 710.0 | 865.3 | 929.0 | 1004.0 | 1056.6 | 1108.1 |
| Greece | 107.9 | 162.1 | 113.9 | 114.2 | 111.1 | 115.5 | 116.3 |
| Hungary | 303.1 | 270.2 | 268.5 | 268.7 | 272.0 | 2694.9 | 285.5 |
| Iceland | 3.1 | 5.8 | 7.2 | 6.9 | 7.2 | 7.8 | 7.9 |
| Ireland | 84.0 | 91.0 | 88.8 | 103.4 | 109.7 | 103.7 | 104.7 |
| Italy | 761.8 | 695.0 | 822.3 | 865.0 | 889.0 | 938.6 | 914.0 |
| Latvia | 4.9 | 15.2 | 20.7 | 22.1 | 22.9 | 23.7 | 25.9 |
| Lithuania | 25.1 | 55.8 | 69.5 | 75.5 | 74.6 | 79.2 | 87.4 |
| Macedonia Rep | 3.9 | 3.0 | 2.4 | 3.6 | 3.0 | 2.5 | 2.3 |
| Malta | 6.0 | 4.4 | 4.6 | 4.3 | 4.1 | 4.2 | 4.1 |
| Moldova | 14.4 | 24.4 | 21.5 | 33.7 | 36.7 | 31.2 | 31.4 |
| Netherlands | 766.2 | 712.2 | 927.0 | 877.8 | 906.3 | 900.3 | 932.6 |
| Norway | 43.0 | 49.8 | 71.2 | 75.9 | 75.1 | 81.0 | 104.0 |
| Poland | 531.1 | 799.8 | 1086.4 | 1115.1 | 1165.0 | 1414.3 | 1520.7 |
| Portugal | 221.3 | 213.9 | 288.6 | 309.5 | 284.0 | 282.9 | 340.4 |
| Romania | 251.1 | 274.9 | 302.3 | 278.9 | 254.8 | 275.9 | 245.7 |
| Russian Federation | 752.2 | 1326.7 | 2304.7 | 2548.9 | 2875.3 | 3285.3 | 3448.3 |
| Serbia | - | - | 79.3 | 85.4 | 95.9 | 84.1 | 88.0 |
| Slovakia | 16.0 | 78.4 | 83.8 | 78.9 | 65.5 | 66.0 | 67.6 |
| Slovenia | 17.7 | 45.3 | 47.1 | 45.9 | 47.1 | 48.7 | 47.0 |
| Spain | 983.5 | 1060.6 | 1120.2 | 1029.0 | 1158.7 | 1151.7 | 1129.2 |
| Sweden | 91.3 | 99.9 | 109.1 | 115.0 | 113.9 | 112.1 | 119.8 |
| Switzerland | 39.0 | 52.7 | 63.2 | 67.1 | 70.4 | 74.4 | 78.0 |
| Ukraine | 190.0 | 463.0 | 766.0 | 859.8 | 880.1 | 920.0 | 1019.6 |
| United Kingdom | 1222.0 | 1315.0 | 1292.2 | 1402.7 | 1368.9 | 1408.8 | 1471.3 |
| EUROPEAN UNION | 8301.4 | 8815.5 | 9743.5 | 9925.5 | 10220.2 | 10653.0 | 10892.6 |
| EUROPE | 9464.7 | 10878.8 | 13278.8 | 13872.9 | 14575.0 | 15513.3 | 16072.3 |
| - no figure | |||||||
| Source: FAO | |||||||
Production in Europe looks likely to rise to around 16.7 million tonnes in 2015, which would represent almost 17 per cent of the estimated world total of some 99 million tonnes.
In terms of the number of birds slaughtered, the world total rose from 40,635 million to almost 61,299 million between 2000 and 2013, the corresponding figures for Europe being 6,881 million and 10,208 million.
The average slaughter weight per bird in Europe increased during the period from 1.38kg to 1.58kg, while the world average went up from 1.4kg to 1.57kg. Putting this into perspective the average eviscerated weight in the Americas increased from 1.7kg to almost 2kg per bird.
The ranking of countries (Table 3) shows that in 2013 there were seven producing more than a million tonnes of chicken meat a year, their combined output amounting to almost 11 million tonnes or 68 per cent of the regional total. Since 2000 there has been some dramatic changes in the data.
| Table 3. Chicken meat production ranking in Europe in 2013 | |
| Country | ('000 tonnes) |
|---|---|
| Russian Federation | 3448.3 |
| Poland | 1520.7 |
| United Kingdom | 1471.3 |
| France | 1205.6 |
| Spain | 1129.2 |
| Germany | 1108.1 |
| Ukraine | 1019.6 |
| Netherlands | 932.6 |
| Italy | 914.0 |
| Belarus | 365.1 |
| Belgium | 362.2 |
| Portugal | 340.4 |
| Hungary | 285.5 |
| Czech Rep | 254.9 |
| Romania | 245.7 |
| Denmark | 168.0 |
| Sweden | 119.8 |
| Greece | 116.3 |
| Austria | 107.5 |
| Finland | 105.4 |
| Ireland | 104.7 |
| Norway | 104.0 |
| Bulgaria | 102.5 |
| Serbia | 88.0 |
| Lithuania | 87.4 |
| Switzerland | 78.0 |
| Slovakia | 67.6 |
| Slovenia | 47.0 |
| Bosnia/Herzegovina | 40.7 |
| Moldova | 31.4 |
| Croatia | 26.1 |
| Latvia | 25.9 |
| Estonia | 16.9 |
| Albania | 15.8 |
| Iceland | 7.9 |
| Malta | 4.1 |
| Macedonia Rep | 2.3 |
Back in 2000, only two countries, France and the United Kingdom, produced more than a million tonnes a year. The Russian Federation (now number one in the ranking table) and Poland (number two) were placed sixth and eighth, while the Ukraine (now seventh) was fourteenth!
The United States Department of Agriculture compiles data relating to what it considers to be broiler meat production (Table 4 and figures 1 and 2). While the absolute figures differ from the FAO chicken meat data which includes estimates of backyard production and the meat from culled layers, the trends are similar. It is clear from both sets of figures that the Ukraine, the Russian Federation and Poland are the fastest growing industries.
| Table 4. Leading broiler producers in Europe ('000 tonnes) | ||||||||||||
| Country | 2000 | 2005 | 2006 | 2007 | 2008 | 2009 | 2010 | 2011 | 2012 | 2013 | 2014 | 2015F |
|---|---|---|---|---|---|---|---|---|---|---|---|---|
| Russian Federation | 410 | 950 | 1180 | 1410 | 1680 | 2060 | 2310 | 2575 | 2830 | 3010 | 3250 | 3400 |
| United Kingdom | 1163 | 1283 | 1290 | 1261 | 1214 | 1220 | 1323 | 1297 | 1322 | 1391 | - | - |
| Poland | 560 | 800 | 824 | 896 | 730 | 1060 | 1123 | 1150 | 1325 | 1450 | - | - |
| Germany | 587 | 710 | 749 | 826 | 868 | 911 | 1073 | 1150 | 1160 | 1190 | - | - |
| France | 1242 | 986 | 886 | 993 | 1009 | 1008 | 1041 | 1096 | 1091 | 1146 | - | - |
| Spain | 965 | 1045 | 1030 | 1034 | 1059 | 1063 | 1085 | 1073 | 1063 | 1041 | - | - |
| Italy | 762 | 666 | 612 | 670 | 713 | 742 | 780 | 796 | 816 | 820 | - | - |
| Ukraine | 20 | 289 | 372 | 475 | 570 | 650 | 733 | 767 | 800 | 899 | 964 | 980 |
| Netherlands | 697 | 552 | 547 | 612 | 626 | 655 | 664 | 710 | 738 | 750 | - | - |
| EU - 27 | 7970 | 8169 | 7740 | 8492 | 8526 | 8949 | 9478 | 9320 | 9565 | 9910 | 10095 | 10215 |
| F forecast, - no figure | ||||||||||||
| Sources: AVEC, USDA | ||||||||||||
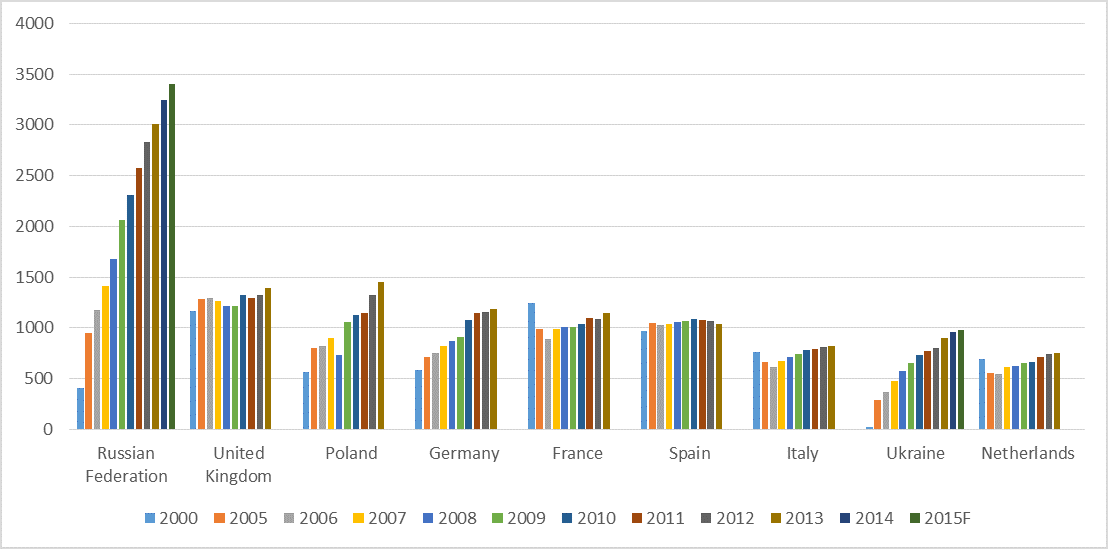
Figure 1. The leading broiler meat producers in Europe ('000 tonnes)
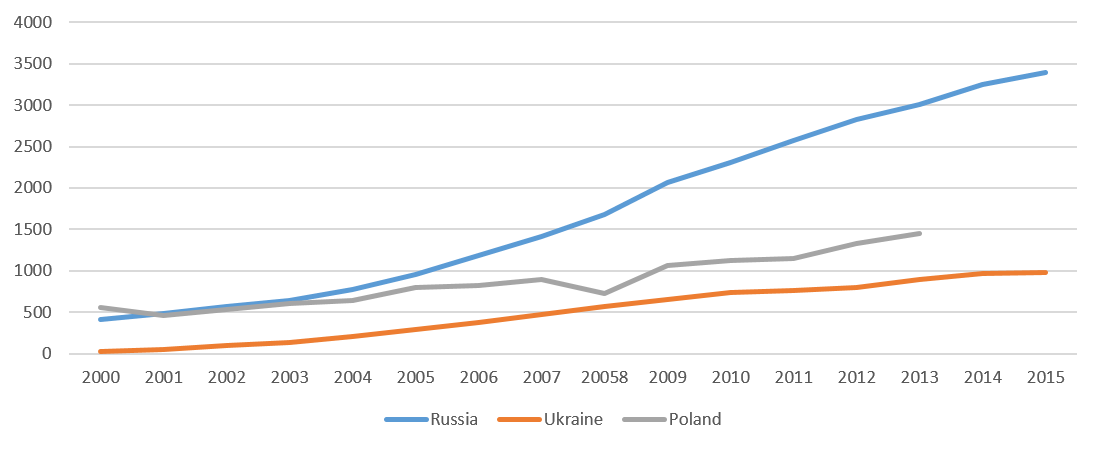
Figure 2. The Ukraine, Russia and Poland have recorded the fastest growths in Europe ('000 tonnes)
For the Russian Federation broiler output is expected to rise further this year to a record 3.4 million tonnes while production in the Ukraine will approach a million tonnes. For the EU as a whole the total is forecast at 10.2 million tonnes.
According to a USDA Gain Report, expansion in the EU reflects a slowly growing domestic demand as the economic recession has hit poultry less than other more expensive meats. Low feed prices have also helped push up production.
Between 2014 and 2024 the EU Commission expects poultry meat (all forms) production to expand slowly at just 0.7 per cent per year from a shade over 13 million tonnes to nearly 14 million tonnes, the strongest increases occurring in Hungary, Poland and Romania. Growth is also anticipated in the UK, Benelux, Spain, Poland, Germany and Italy.
However, the outlook for France is for a decline, mainly reflecting a loss of export markets to the Middle East following the end of the EU-28 export subsidy, coupled with the financial difficulties incurred by some large companies.
In 2015 Russia is expected to reach its self-sufficiency target such that imports will likely amount to no more than 10 per cent of domestic consumption. Based on the USDA broiler data, production in Russia will have increased by more than 13 per cent per year between 2005 and 2015 to reach 3.4 million tonnes eviscerated weight.
However, a recent Gain Report considers this to be an underestimate and that production will likely come close to 3.55 million tonnes this year and that further expansion is anticipated for 2016 to 3.65 million tonnes.
The Russian Ministry of Agriculture is forecasting poultry meat output in 2020 to exceed six million tonnes live weight, equivalent to around 4.4 million tonnes eviscerated weight, most of which will be broiler meat.
Near-term concerns are a slow-down in consumer demand and, more importantly, the possibility of outbreaks of Highly Pathogenic Avian Influenza (HPAI). Two cases of H5N1 were reported in the Astrakhan and Tyva regions earlier this year. According to the Russian Union of Poultry producers, reported in a USDA Gain Report, just 10 companies account for 40 per cent of broiler production. Consequently, any outbreaks where these operations are located could lead to major cutbacks in production.
Earlier forecasts had put Ukraine’s broiler production this year at more than a million tonnes but this figure has since been revised downwards to around 980,000 tonnes as anticipated growth has slowed as a result of currency exchange rate movements and a weakened domestic demand.
Nevertheless, a USDA report notes that the commercial poultry sector remains strong as red meat consumption falls, and all the major producers have reported a stronger consumer demand and increases in sales. However, producers have also had lower incomes due to devaluation and a real decline in prices. Hence, exports will serve as a major revenue source for large producers.
November 2015