GLOBAL POULTRY TRENDS - Oceania’s Growth Linked to Australia
Poultry meat consumption rises in Oceania are beating the world average, reports industry analyst Terry Evans. 22 March 2016
 10 minute read
 By:
By: Chicken meat output in Oceania represents just 1.3 per cent of the world total.
Between 2000 and 2013 production expanded at a healthy 4.2 per cent per year as it climbed from 736,000 tonnes to 1.26 million tonnes. This increase is directly related to the growth in Australia where output rose from 614,000 tonnes to 1.06 million tonnes, as this country accounts for some 84 per cent of the regional total (Table 1 and figure 1).
| Table 1. Chicken meat production in Oceania ('000 tonnes eviscerated weight) | |||||||
|---|---|---|---|---|---|---|---|
| Country | 2000 | 2005 | 2009 | 2010 | 2011 | 2012 | 2013 |
| American Samoa | * | * | * | * | * | * | * |
| Australia | 613.6 | 760.5 | 834.5 | 883.2 | 1019.1 | 1039.1 | 1061.0 |
| Cook Isl | * | * | * | * | * | * | * |
| Fiji | 8.1 | 11.8 | 11.7 | 14.3 | 20.4 | 15.7 | 16.5 |
| French Polynesia | 0.5 | 0.5 | 0.5 | 0.4 | 0.5 | 0.5 | 0.5 |
| Guam | * | * | * | * | * | * | * |
| Kiribati | 0.3 | 0.5 | 0.7 | 0.8 | 0.8 | 0.8 | 0.8 |
| Micronesia Fed St | 0.1 | 0.1 | 0.1 | 0.1 | 0.1 | 0.1 | 0.1 |
| Nauru | * | * | * | * | * | * | * |
| New Caledonia | 0.8 | 1.0 | 0.8 | 0.9 | 0.8 | 0.9 | 0.9 |
| New Zealand | 105.3 | 158.5 | 136.9 | 144.4 | 159.9 | 172.1 | 171.2 |
| Niue | * | * | * | * | * | * | * |
| Papua New Guinea | 5.4 | 5.6 | 5.8 | 5.8 | 5.9 | 6.0 | 6.0 |
| Samoa | 0.4 | 0.5 | 0.6 | 0.6 | 0.6 | 0.6 | 0.6 |
| Solomon Isl | 0.3 | 0.3 | 0.3 | 0.3 | 0.3 | 0.3 | 0.3 |
| Tokelau | * | * | * | * | * | * | * |
| Tonga | 0.3 | 0.3 | 0.3 | 0.3 | 0.3 | 0.3 | 0.3 |
| Tuvalu | * | * | * | * | * | * | * |
| Vanuatu | 0.4 | 0.6 | 1.0 | 0.8 | 0.8 | 0.8 | 0.8 |
| Wallis/Futuna Isl | * | * | * | * | * | * | * |
| OCEANIA | 735.7 | 940.4 | 993.4 | 1052.1 | 1209.6 | 1237.3 | 1259.3 |
| E estimated, * less than 50 tonnes | |||||||
| Source: FAO | |||||||
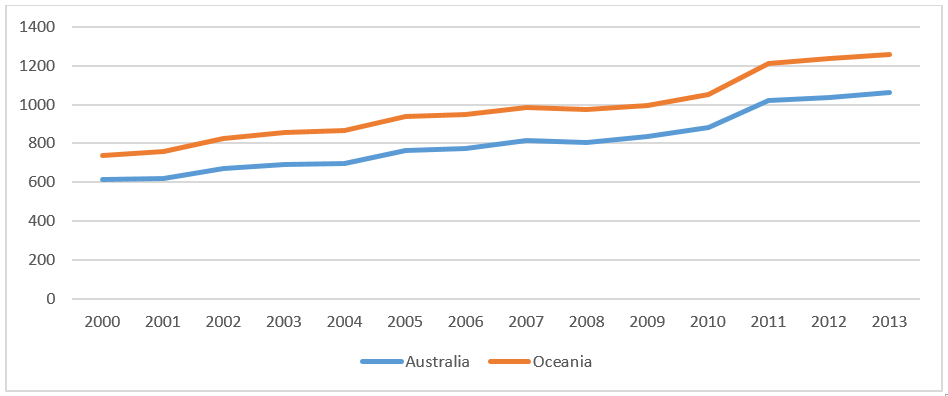
Figure 1. Australia accounts for 84 per cent of Oceania's chicken meat output ('000 tonnes)
Chicken production is set to continue to grow and is forecast by the Australian Bureau of Agricultural and Resource Economics (ABARES) to reach 1.16 million tonnes in 2015/16 and further to 1.32 million tonnes in 2019/20. So, it will its number one position as the most consumed meat in Australia, accounting for 28 per cent of meat production compared with around 25 per cent in 2013/14.
New Zealand, the second largest producer in the region, saw its industry grow by 3.8 per cent per year to 2013 when chicken meat output reached a similar level to the previous year at 171,000 tonnes. The Poultry Industry Association of New Zealand (PIANZ) considers that the production of all forms of poultry meat in that year amounted to 177,000 tonnes rising to almost 190,000 tonnes in 2014.
Although production in Fiji in 2012 and 2013 failed to match the “high” of more than 20,000 tonnes in 2011, output has nevertheless, doubled since 2000.
Imports double
Imports of fresh/frozen chicken meat into the region have more than doubled since 2000 to exceed 66,000 tonnes in 2012 (Table 2). Three countries dominate this trade, Samoa (taking almost 13,500 tonnes in 2012) French Polynesia (13,200 tonnes) and Papua New Guinea (12,100 tonnes).
| Table 2. Imports of fresh/frozen chicken meat by countries in Oceania (tonnes) | |||||||
|---|---|---|---|---|---|---|---|
| Country | 2000 | 2005 | 2008 | 2009 | 2010 | 2011 | 2012 |
| American Samoa | 1600 | 0 | 0 | 0 | 0 | 0 | 0 |
| Australia | 0 | 0 | 270 | 1297 | 1837 | 2113 | 5126 |
| Cook Isl | 520 | 914 | 729 | 637 | 878 | 1538 | 986 |
| Fiji | 707 | 2782 | 1408 | 1116 | 1419 | 1137 | 2101 |
| French Polynesia | 9912 | 11068 | 11888 | 12312 | 12755 | 13763 | 13220 |
| Guam | 0 | 12 | 0 | 0 | 0 | 0 | 0 |
| Kiribati | 570 | 1347 | 757 | 762 | 617 | 492 | 641 |
| New Caledonia | 5300 | 7183 | 8024 | 8627 | 7709 | 8478 | 7893 |
| New Zealand | 0 | 0 | 0 | 0 | 0 | 0 | 21 |
| Niue | 60 | 50 | 54 | 45 | 60 | 25 | 54 |
| Papua New Guinea | 1 | 858 | 2269 | 3881 | 3779 | 6169 | 12058 |
| Samoa | 4100 | 7091 | 7191 | 7489 | 9660 | 10859 | 13467 |
| Solomon Isl | 100 | 119 | 657 | 817 | 879 | 2801 | 1078 |
| Tonga | 2531 | 3226 | 3475 | 5376 | 7156 | 9512 | 7496 |
| Tuvalu | 290 | 174 | 234 | 286 | 336 | 325 | 345 |
| Vanuatu | 740 | 715 | 1169 | 1348 | 1720 | 1933 | 1873 |
| OCEANIA | 26431 | 35539 | 38125 | 43993 | 48805 | 59145 | 66359 |
| Source: FAO | |||||||
Details regarding the trade with Samoa and Papua New Guinea are not available but for French Polynesia, the main suppliers were the USA (11,200 tonnes) and to a much lesser extent, Argentina (1,700 tonnes).
Just two countries dominate the export trade from this region - Australia and New Zealand - as total sales escalated from around 14,300 tonnes to almost 40,000 tonnes by 2012 (table 3).
| Table 3. Exports of fresh/frozen chicken meat from countries in Oceania (tonnes) | |||||||
|---|---|---|---|---|---|---|---|
| Country | 2000 | 2005 | 2008 | 2009 | 2010 | 2011 | 2012 |
| Australia | 14127 | 17466 | 271879 | 29231 | 24741 | 29235 | 31260 |
| Fiji | 3 | 7 | 88 | 98 | 29 | 61 | 24 |
| New Zealand | 128 | 4356 | 3738 | 3998 | 4379 | 3457 | 8091 |
| Vanuatu | - | - | 0 | 0 | 0 | 14 | 14 |
| OCEANIA | 14258 | 21829 | 31015 | 33327 | 29149 | 32767 | 39389 |
| - No figure | |||||||
| Source: FAO | |||||||
Australia’s exports more than doubled during the review period from 14,100 tonnes to exceed 31,200 tonnes.
In 2012 the bulk of the business was conducted with Papua New Guinea (11,500 tonnes) while 4,800 tonnes went to the Philippines, 4,400 tonnes to Hong Kong, 3,300 tonnes to South Africa and 1,700 tonnes to Vanuatu. In general, exports account for around 3 per cent of Australia’s production.
Some 95 per cent comprise frozen cuts and offal including feet, kidneys and livers, which attract a higher price than in domestic markets. The remaining 5 per cent is mainly frozen whole birds.
In 2014/15 exports are estimated to have risen 14 per cent to 40,500 tonnes and by a further 3 per cent in 2015/16 to 41,600 tonnes. By 2019/20 shipments of some 47,400 tonnes are anticipated.
Australia’s chicken imports are small because of biosecurity restrictions which are intended to prevent the entry of diseases that could affect the domestic flock.
New Zealand’s exports have expanded quite dramatically since 2000 though the total in 2012 was only around 8,100 tonnes with Australia (4,400 tonnes) and Fiji (2,000 tonnes) the main recipients.
Consumption rise beats the world average
Oceania’s human population currently stands at just over 39 million and is forecast to rise to more than 47 million by 2030 (Table 4). Some 4.5 million of this 8 million increase will come about as a result of the anticipated expansion in Australia.
Between 2000 and 2011, poultry meat consumption in the region, with an annual average growth of more than 3 per cent between 2000 and 2011, has risen faster than the world figure of around 2.5 per cent (Table 4 and figure 2).
| Table 4. Human population of Oceania and poultry meat consumption | ||||||||||
|---|---|---|---|---|---|---|---|---|---|---|
| Human population | Poultry meat consumption | |||||||||
| (millions) | (kg/person/year) | |||||||||
| Country | 2000 | 2015 | 2020 | 2030 | 2000 | 2007 | 2008 | 2009 | 2010 | 2011 |
| American Samoa | 0.1 | 0.1 | 0.1 | 0.1 | - | - | - | - | - | - |
| Australia | 19.1 | 24.0 | 25.6 | 28.5 | 32.4 | 39.0 | 37.3 | 38.2 | 40.1 | 45.1 |
| Cook Isl | # | # | # | # | - | - | - | - | - | - |
| Fiji | 0.8 | 0.9 | 0.9 | 0.9 | 12.4 | 18.7 | 18.6 | 15.0 | 18.7 | 24.6 |
| French Polynesia | 0.2 | 0.3 | 0.3 | 0.3 | 40.1 | 46.8 | 45.6 | 46.0 | 45.8 | 48.5 |
| Guam | 0.2 | 0.2 | 0.2 | 0.2 | - | - | - | - | - | - |
| Kiribati | 0.1 | 0.1 | 0.1 | 0.1 | 13.2 | 21.6 | 17.8 | 16.4 | 14.9 | 15.6 |
| Marshall Isl | 0.1 | 0.1 | 0.1 | 0.1 | - | - | - | - | - | - |
| Micronesia Fed St | 0.1 | 0.1 | 0.1 | 0.1 | - | - | - | - | - | - |
| Nauru | # | # | # | # | - | - | - | - | - | - |
| New Caledonia | 0.2 | 0.3 | 0.3 | 0.3 | 31.7 | 42.2 | 41.1 | 43.5 | 40.7 | 43.7 |
| New Zealand | 3.9 | 4.5 | 4.7 | 5.1 | 26.7 | 34.4 | 33.5 | 30.7 | 32.2 | 35.5 |
| Niue | # | # | # | # | - | - | - | - | - | - |
| N Mariana Isl | 0.1 | 0.1 | 0.1 | 0.1 | - | - | - | - | - | - |
| Palau | # | # | # | # | - | - | - | - | - | - |
| Papua New Guinea | 5.4 | 7.6 | 8.4 | 10.1 | - | - | - | - | - | - |
| Samoa | 0.2 | 0.2 | 0.2 | 0.2 | 24.5 | 34.4 | 40.4 | 41.5 | 52.3 | 58.1 |
| Solomon Isl | 0.4 | 0.6 | 0.6 | 0.8 | 0.8 | 1.6 | 2.0 | 2.3 | 2.4 | 6.0 |
| Tokelau | # | # | # | # | - | - | - | - | - | - |
| Tonga | 0.1 | 0.1 | 0.1 | 0.1 | - | - | - | - | - | - |
| Tuvalu | # | # | # | # | - | - | - | - | - | - |
| Vanuatu | 0.2 | 0.3 | 0.3 | 0.4 | 6.7 | 8.3 | 10.6 | 10.6 | 11.4 | 12.2 |
| Wallis/Futuna Isl | # | # | # | # | - | - | - | - | - | - |
| OCEANIA | 31.1 | 39.3 | 42.1 | 47.4 | 30.1 | 36.8 | 35.4 | 35.6 | 37.4 | 42.1 |
| # less than 50,000 | ||||||||||
| - No figure | ||||||||||
| Source: FAO | ||||||||||
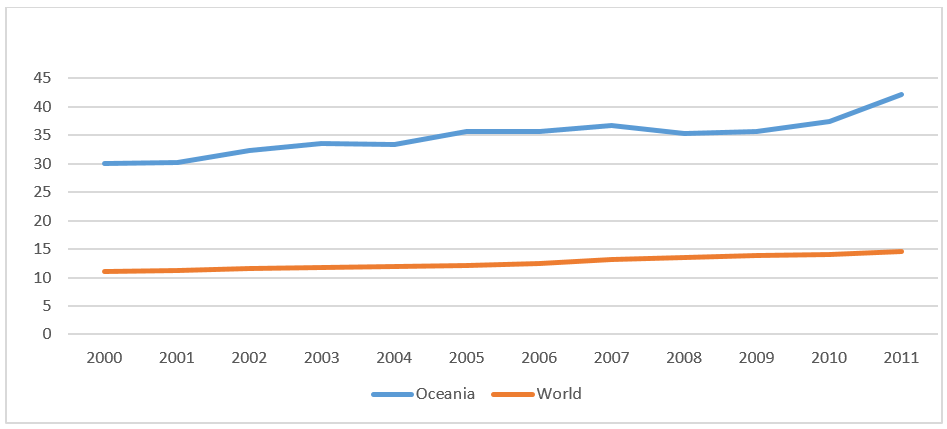
Figure 2. Oceania's poultry meat consumption has risen faster than the world average (kg/person/year)
In the most populated country, Australia, average poultry meat consumption has increased from 32.4kg per person in 2000 to 45.1kg in 2011.
However, data provided by ABARAS postulates a nearly 2 per cent rise in chicken uptake in 2014/15 to 45.4 kg per person with a further 2 per cent increase in 2015/16 to 46.1kg, which compares with 31.3kg for beef and veal, 27.3kg for pig meat and only 10kg for mutton and lamb, the latter having slumped from 18.5kg back in 2000.
Over the five years to 2014/15 chicken meat has been on average 50 per cent cheaper than pork, 59 per cent cheaper than lamb and 65 per cent cheaper than beef. So, chicken now accounts for nearly one-quarter of meat production in Australia compared with 20 per cent a decade ago.
By 2019/20 uptake is anticipated to average 49.2kg per person. Chicken meat sales breakdown into 34 per cent fresh pieces, 30 per cent whole fresh birds, 29 per cent processed, and just 7 per cent frozen.
In contrast to the beef and sheep meat sectors the chicken industry is highly concentrated and vertically-integrated with around 70 per cent of output supplied by two privately-owned companies.
The changes in consumer attitudes to chicken are put down to the greater diversity in the range of items offered, the improved quality and consistency of chicken products and improved price competitiveness. Two factors have influenced the latter.
Firstly, an increase in the number of automated processing plants and improvements in production efficiency. Nowadays a 2kg live weight bird is produced in around 35 days compared with 39 days in 2000.
The picture in New Zealand is somewhat similar. Here, based on the FAO data, poultry meat uptake has risen from 26.7kg per person in 2000 to 35.5kg in 2011. At least one forecast puts current uptake at around 37kg of which chicken is considered to account for 35.7kg per person.
Factors favouring sustainable growth have been industry-funded innovation in processing and sound marketing. The increases in chicken consumption have been mainly in the fresh and further-processed sectors, with some 77 per cent of chicken now sold fresh.
For the other countries in the region for which the FAO has produced data (Table 4) the levels of poultry meat consumption are well above the world average with the exceptions of the Solomon Isles and Vanuatu.