Use flock data to make better decisions
The goal of any broiler breeder program is to produce the greatest number of hatching eggs per hen housed and life of flock hatch to give us the most chicks per hen housed. 26 November 2018
 5 minute read
By Shawn Carlton, North America Technical Support — Breeder Specialist
A production data analysis can help determine which flocks are meeting their genetic potential and which flocks are not. When conducting a production data analysis, you want to look at body weight curves, uniformity, production, and female and male mortality throughout the pullet and hen growing phases. Identifying trends in these measurements can help determine which key performance indicators we could be missing to give us the desired results. Comparing your top and bottom flocks can provide insight into why the bottom flocks are underperforming.
Key areas of focus:
- Achieving standard 4-week body weight to promote flock uniformity.
- Preventing female and male body weights from being overweight during the maintenance phase (from 6 to 15 weeks of age).
- Females getting the proper turn-up from 16 to 20 weeks of age (this is very important as birds are preparing for the lay phase). Proper turn-up in this phase is 35%.
- Controlling male body weight no at move – Males MUST be synchronised with females at move.
- Having a smooth transition from the rearing house to the production house.
Data Collection
The success of any breeder program must be driven with data. Decision-making is dependent upon the quality of data and ensuring that the numbers are accurate and complete. This means making sure that everyone within the complex collects data in the same format as variability in how data is collected or tracked can skew results. For example, when weighing birds, weigh all the houses the same way (ex: weighing three pens in the house to get an accurate average weight, weighing all the birds that are caught to weigh). Also, it is important to identify and remove outliers from the production data analysis as leaving in these data points can skew results. Removing these outliers will give you a more accurate picture of overall flock performance.
Egg Production
Producing the greatest number of chicks per hen housed (Chicks/HH) at the lowest cost is the ultimate goal of a broiler breeder management program. Therefore, looking at egg production is the first step in a production data analysis. Once the top and bottom flocks have been identified, it is easier to see what could be causing the discrepancy.
There are a number of factors that can be attributed to low egg production:
- Improper or poor lighting – Must have a tenfold increase in intensity from pullet to hen house.
- Using the wrong light spectrum – Production birds need the red/orange spectrum to be stimulated. When using LED bulbs a 2700 Kelvin rating is recommended.
- Poor light placement and spacing in the house.
- Inadequate feeder space.
- Inadequate water volume or water availability at peak demand times.
- Too much stress (as a result of vaccinations or moving from the rearing to the laying house).
- Lack of nutrients in feed.
- Not achieving Cobb body weight standards.
It may be difficult to determine which factors may be contributing to low egg production as even a one to two percent difference in mortality can have a big effect on production. For example, a one percent increase in hen mortality is roughly equal to 1.5 fewer hatching eggs. Therefore, egg production can be greatly affected by seemingly insignificant differences between flocks.
Hatchability is another big driver of chicks per hen housed. It is important to manage male weights and fleshing in the hen house.
.PNG)
Other measurements that should be collected in a production data analysis are body weight curves and uniformity. It is important to make sure that each flock’s body weight curve is matching or close to matching the Cobb standard by the time of light stimulation. Body weights that are too low or too high can negatively affect peak production. Typically, bottom flocks stall on weights between weeks 16 and 20 if they are heavy in the maintenance phase of rearing, or if they achieve too much body weight gain early in the production house. It is advisable to increase feed intake during production so that the hens can perform to the best of their abilities during egg production, at which point bottom flocks can actually surpass the top flocks. Thus, it is possible to fix poor-performing flocks, but only if you are keeping track of that data.
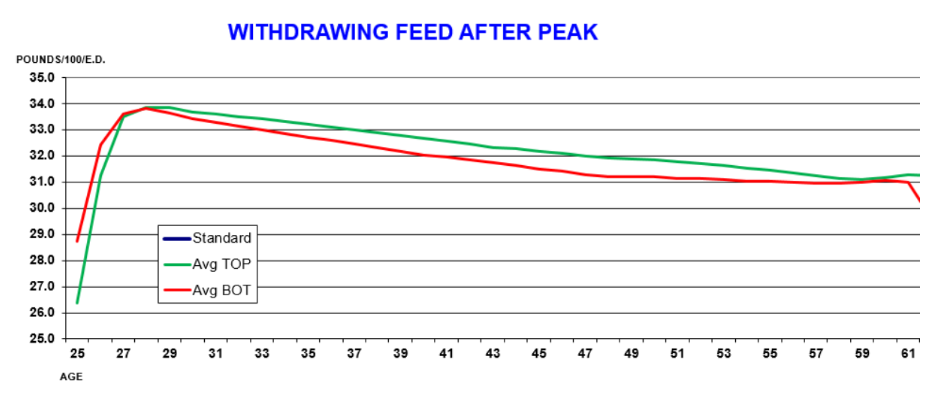
Feed Curves
Finally, measuring the feed curves of each flock is the last step to conducting a production data analysis. As feed directly impacts body weights, which directly impacts egg production, this key performance indicator can be the most telling difference between the top- and bottom-performing flocks. In general, the feed curve should increase through peak production, at which point it should decrease at about 29 weeks.
There are many factors that can contribute to feed curves. Amount of feed is typically the most influential, but other factors such as nutrient availability, feeding space and water quantity/quality can also impact feed curves.
.PNG)
Conclusion
At the end of the day, decisions should be made according to data collected at your particular location. When it comes to poultry farming, especially broiler breeding, a small variation can have a dramatic impact on your bottom line. That’s why consistent and accurate recording of data is key to staying on top of which aspects of production need adjustment.