

Meat Products: Competition from Low Cost Countries
By Peter van Home and Robert Hoste for the FAO. The EU is a leading exporter of meat: net exporter for pork and poultry and net importer for beef.Key findings
Major flows are trade between EU countries. The trade balance in meat of the EU developed negatively: the surplus decreased.
The EU has a negative trade balance for beef. International trade is mainly based on frozen, cooked or further processed meat products.
The EU industry should focus on the production of fresh products for the demanding European customer. In this market segment the local industry has an advantage over third countries.
The competitiveness of the EU meat industry is weak. Third countries like Brazil and Argentina have competitive advantages in meat production as a result of relatively cheap inputs like feed (abundance land for forage and cereal production) and labour.
Large and reliable livestock supplies and low labour costs combined with economies of scale are key factors contributing to the competitiveness of the meat industry. Due to higher labour costs, the US has these advantages to a limited extent.
The need for consolidation will be a key issue in the meat industry. Only bigger companies with an adequate scale can exploit the opportunity to supply the different preferences for particular meat cuts between countries.
The EU meat industry is currently protected by trade barriers, such as high import tariffs, quotas and sanitary protection.
Due to recurrent outbreaks of animal diseases and the fact that outbreaks are difficult to foresee, global meat trade is and will be restricted and less structured.
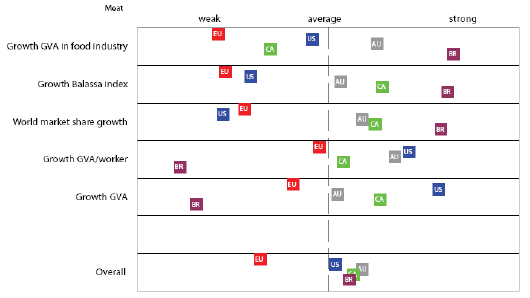
Competitive position of the ELI Food Industry sectors in the global and EU Market
FAO
The competitors are not consistently strong in all competitiveness indicators. The Brazilian meat industry is growing in importance within their food industry and on the export market. The Brazilian growth of real value added and labour productivity is weak. The opposite applies to the US. On average all competitors are stronger than the EU-15.
Introduction
World marketMeat plays an important role in food consumption. Different types of meat are produced and consumed: pork, poultry, beef, sheep and goat and various other meat types. Beef and ovine meat production typically originate from grass-fed animals.
Pigs and poultry are omnivorous animals and fed mainly with compound feed. In general these animals are kept inside and rather footloose to production areas of feed. The 2006 forecast for total meat production in the world amounts to 272.5 million tons (carcass weight equivalent). In the EU-25 it amounts to 41.3 million tons, 15.1% of the world meat production (FAO, 2006). Delgadoetal. (1999) predict an increase in meat demand to 303 million tons in 2020.
China is a large meat producer with over 50% of the pork production and one third of all meat production. Chinese exports amount to just 3%, below the countries used in the benchmark. China however is expected to become a large net meat importer in the future, given an expected major increase in meat consumption caused by increasing income and wealth of the Chinese, in combination with a limited national feed/food supply which also competes with human food demand.

Source: FAOstat, 2006 forecast (FAO, 2006).
About half of the production and consumption of meat in the EU-25 is pork. The production of pig and poultry meat is growing and the production of beef and ovine meat is declining.
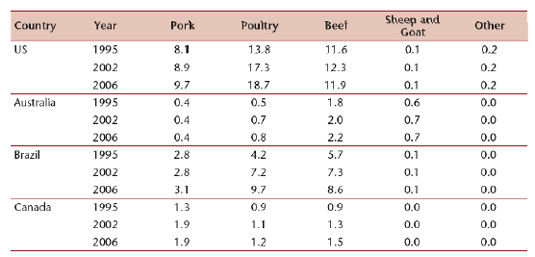
The same development is evident in the EU since 1995. The forecast of the FAO indicates a decrease in 2006 for poultry and beef in the EU. Pork production increased in all countries, quite strongly in the US and Canada. Brazil shows a strong increase in poultry and beef production.
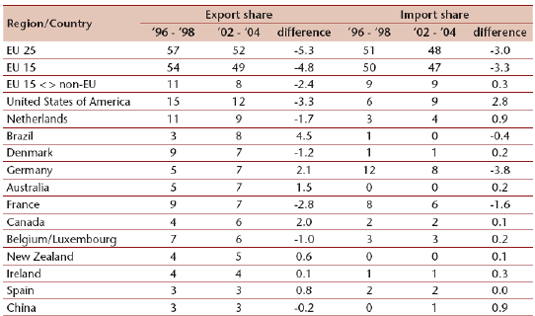
Sheep and goat meat is of less importance in the total meat production: EU-15 and Australia are the most important producers. Europe is the largest exporter of meat, but also the largest importer. If the intra trade within the EU member states is excluded, the EU-15 is the second largest exporter after the US. The figures in table 2 show that Australia, Brazil and Canada increased their share on the world export markets, which is in line with the production growth as mentioned in table 1. China, the world's largest pork producer, is the next biggest exporter after these countries. This country is not chosen as benchmark due to the lack of data.
FAO
Competitive position of the EU Food industry sectors in the global and EU Market
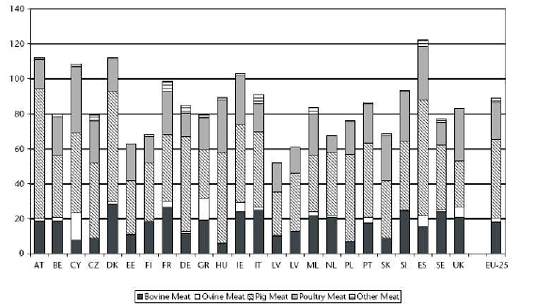
Consumption per headConsumption volume and pattern differ between countries. About 40% of all meat consumed in the world is pork, followed by poultry meat at 30%, and beef at 25%. EU-25 consumers are important meat consumers, with annually 89.0 kg per head, compared to 40.3 kg per head in the world in total. Pork and poultry meat consumption in the world is growing. Figure 2 shows the meat consumption per EU member state and per type of meat.
Based on FAOStat data
Competitiveness of the European Food Industry - An economic and legal assessment 2007
Competition: Balassa index and share value addedThe variation in meat consumption between countries is huge: from 52 kg per head in Latvia to 122 kg in Spain. Ovine meat consumption is also high in Cyprus and Greece, followed by moderate consumption in Ireland, UK and Spain.
The main type of meat is pork with Austria, Denmark and Spain consuming over 60 kg of pork compared with UK, Latvia and Greece with less than 30 kg. Poultry meat is preferred in Cyprus, Hungary, UK and Spain. Beef is less preferred in Hungary and Poland, whereas the Danish and the French consume over 25 kg of beef per head and year.
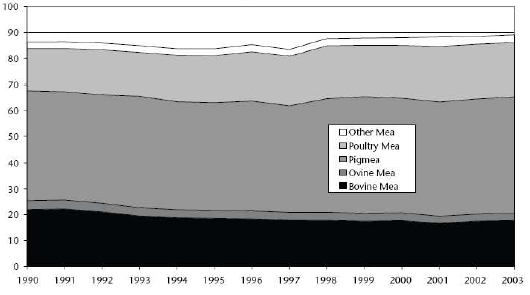
Figure 3 shows the development of meat consumption in the EU-25 since 1990. Meat consumption in the EU-25 increased slightly from 86.3 kg in 1990 to 89.0 kg per head in 2003.
A shift is found towards less beef and sheep and goat meat (-19% and -21%) and more pork (+6%) and particularly poultry (+28%). Also other meat (game, rabbit, horse) increased by 20% over this period.
Table 3 shows the highest Balassa index for Denmark, indicating that Denmark is very specialised in meat export, but of declining importance. Meat export is also relatively important for Brazil and Australia. Brazil shows the highest growth of the revealed comparative index. Meat export of the EU-15 (intra-trade excluded), is less than 1, which indicates relatively low importance. The trend is negative; it is becoming even less important.
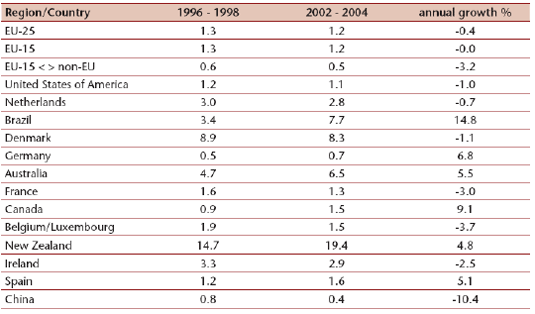
The performance on the domestic market is compared to the food industry as a whole. Thus if the share of real value added of the meat industry in the total food industry grows, the meat industry performs better than the whole.
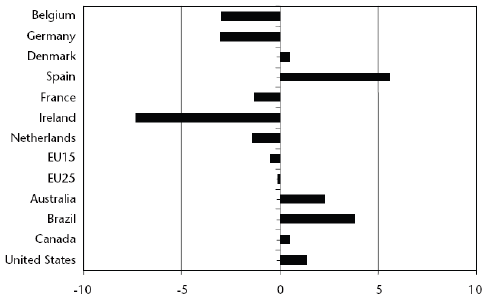
Figure 4 shows that the major competitors of the EU have a fairly high annual growth of the share of the meat industry in the food industry, whereas the EU-15 and also EU-25 countries have a slightly negative annual growth. This shows a rather negative competitiveness of the EU compared to the competitors. Within the EU there is a variation in annual growth, with Poland as a very strong grower, followed by Spain and Italy. Ireland and Germany have negative growth figures.
Some developments can be discussed. Spain appears to be quite a strong grower. Currently (2006) however, the growth of meat production and export is expected to stagnate. The Netherlands, on the other hand, has had a cut in pig numbers forced by policy measures; growth of value added in the meat industry in 2006 is likely to grow.
Further Reading
|
|
- You can view the full report in pdf format (23 pages) by clicking here. |
January 2007


