International Egg and Poultry Review
US - By the USDA's Agricultural Marketing Service - This is a weekly report looking at international developments concerning the poultry industry. 30 May 2008
 3 minute read
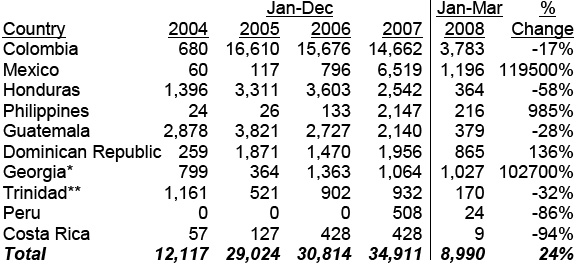
Top Destinations of US Mechanically Separated Chicken (MSC)
Exports under HS1602320035 (MT)
Top Destinations of US Mechanically Separated Turkey (MST)
Exports under HS1602310030 (MT)
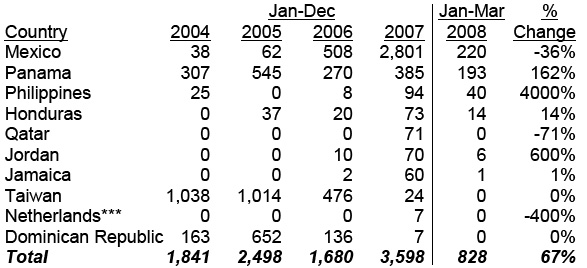
Note: 2008 data is for January through March while all other data is for January through December. Georgia*=Republic of Georgia. Trinidad**=Trinidad and Tobago. Netherlands***=Netherlands Antilles. % Change=Percentage change from the first quarter of 2008 versus 2007. Harmonized System Code (HS) is a universal method of classifying products for trading purposes.
Source: Department of Commerce, US Census Bureau, Foreign Trade Statistics/USDA FAS
US Frozen 15-20% MSC & MST Weighted Average Price
Comparison (cents/pound)
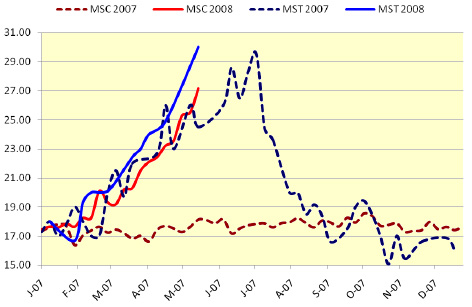
Note: Weighted average prices for MSC are reported as FOB cents per pound while MST prices are delivered cents per pound. MSC weighted average prices represent product bound both domestically and for export, whereas MST prices are export only. All prices reflect frozen 15-20% product traded on the spot market and not contractual. Unlike MST, MSC prices were flat in 2007 with little seasonal pick up in the summer. However 2008 prices steadily increased as a result of good demand and tight supplies, due in part to increased competition from pet food and biodiesel channels for product and raw materials.
Source: USDA AMS Poultry Market News & Analysis
US Poultry Situation
According to USDA ERS, broiler meat production in the first quarter of 2008 was 9.11 billion pounds, up 5.6% from 2007. The rise from the previous year was attributed to the 2.1% decline of broiler meat production in the first quarter of 2007, the 3.6% increase in the number of birds slaughtered in 2008, and the 1.8% increase in the average live weight of birds at slaughter (5.6 pounds) in 2008. The second quarter of 2008 is projected to be 9.38 billion pounds, up 3.2% from 2007. The year-over-year increases in broiler meat production are expected to abate in the second half and first half of 2008 and 2009, due to higher feed and energy costs; however expansion is expected in the second half of 2009 in response to rising prices. Broiler meat production in 2009 is forecast to be 37.2 billion pounds, up 0.8% from the previous year after an increase of 2% in 2008. US broiler and turkey meat exports are expected to reach record highs in 2008 and 2009 as a result of improved competitiveness on the world market due to the weakness of the US dollar. Based on the trendlines, broiler chicks placed are down and RTC pounds are up, though we have yet to see the impact of industry cutbacks announced with immediate effect from March to May of 2008.
US broiler and turkey meat exports were higher in the first quarter of 2008 compared with 2007. According to ERS, broiler exports were 1.5 billion pounds in the first quarter of 2008, up 18% from 2007 due a weakened US dollar value and a rise in consumer purchasing power in certain importing countries. Broiler shipments are expected to rise in the second and third quarters of 2008 and level off in the fourth. Broiler exports are projected to reach a record 6 billion pounds in 2008 and 6.1 billion pounds in 2009. Turkey exports totaled 148 million pounds in the first quarter of 2008, up 19% from 2007 due to strong demand from importing countries like China and Russia. Exports of US turkey meat are expected to reach 635 million pounds in 2009.
Source: USDA ERS/USDA NASS/News Wires
USDA NASS Broiler Chicks Placed Set (‘000 head) and Ready-to-Cook (RTC)
Broiler Meat Produced (‘000 pounds)
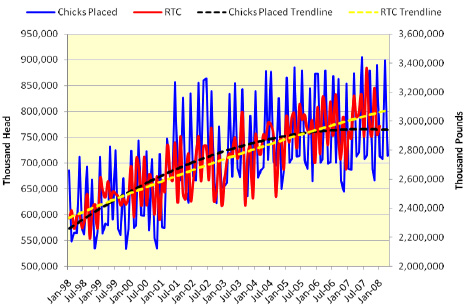
Note: According to USDA NASS, the average hatchability for chickens hatched is about 84%. NASS also reported the ante-mortem condemnation rate for young chickens to be 0.31% and the post-mortem condemnation rate to be 1.22% for March of 2008. The ready-to-cook broiler meat data used in the above graph is total young broiler meat both chilled and frozen. All broiler hatch data is reported on a weekly basis, whereas ready-to-cook broiler meat is reported monthly. For comparison purposes the broiler hatch figures were converted to monthly figures. Due to the inflexibility of the data, we assumed a grow-out of 8 weeks when in reality it is between 6-8 weeks depending on utility. In addition, the graph represents a real time comparison in which chicks placed are compared with RTC volumes at the corresponding time of processing.
Source: USDA NASS
Further Reading
| - | You can view the full report by clicking here. |