

CME: Large Decline in Broiler Demand
US - According to CME's Daily Livestock Report for 6 July, Cooperatives Working Together (CWT)) announced today that it has completed the qualification phase for its 7th dairy herd reduction program.This round of herd retirement removed 101,400 cows heifers from the national’s dairy herd. CWT says that the cows removed accounted for almost two billion pounds of milk per year. CWT removed 367 diary herds in 41 states. Though the announcement did not mention it, our contacts indicated that the remainder of these cows should move to slaughter by the end of July. Dairy cow slaughter was 59,454 head for the week of 20 June, the last week for which data are available. That number is roughly 10,000 head higher than the level before the CWT program began moving cows to slaughter. At that pace, it would take about 10 weeks to slaughter the cows, a time frame that fits reasonably well with the late July conclusion of the program.
CWT Chief Operating Officer that additional CWT herd reductions are likely in 2009 given continued low milk prices and the imbalance between supply and demand.
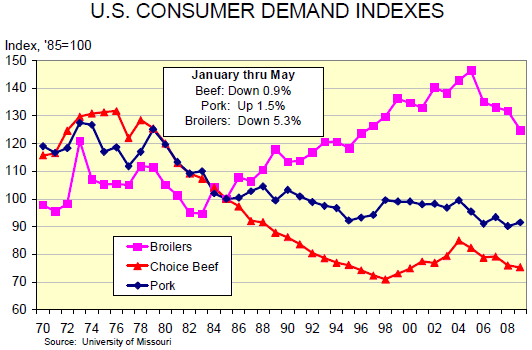
US consumer level demand indexes for January thru May for beef, pork and chicken from Professor Glenn Grimes at the University of Missouri appear in the chart below and they show some rather interesting demand developments. Many readers may be surprised to see such a large decline in broiler demand given the fact that composite broiler prices are performing about as well as any wholesale price we observe. Remember that these are demand indexes that consider both the year-on-year change in domestic per capita consumption and the year-over-year change in retail price. Domestic broiler production is down over 6 per cent this year and retail prices, as published by USDA, have risen only 6.6 per cent. Assuming a retail price elasticity of demand in the –0.65 range, prices would have to be roughly 10 per cent higher to reflect a constant demand for broilers this year, so the index indicates substantially softer chicken demand. In fact, should this change persist for the entire year, US broiler demand would be back to levels not seen since 1996.

The other possible surprise is the pork demand index being 1.5 per cent higher this year. While the buzz over H1N1 and its spread have given the impression that pork demand is just awful. Those report do not square with consumer research conducted by the National Pork Board which indicated that consumers did shy away from pork in late April but quickly returned when they realized that pork was safe. That finding is supported by Grimes computations, which include May data. So why the pork cutout and hog price problems? Simple: More product on the US market. This extra product comes from disrupted exports and from higher-than expected slaughter and slaughter weights since mid-May. Demand is strong. Sellers just have to cut prices to move these large quantities.


