International Egg and Poultry Review: US
US - This is a weekly report by the USDA's Agricultural Marketing Service (AMS), looking at international developments concerning the poultry industry. This week's report covers US exports of mechanically separated chicken (MSC) by volume and value from January to May 2010 with the same period of 2009.
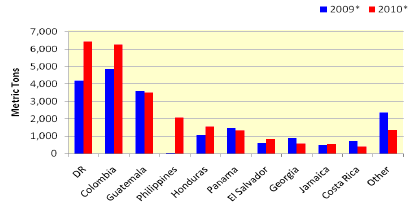
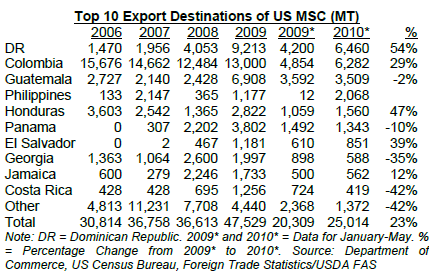
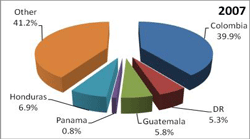
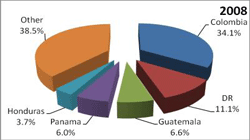
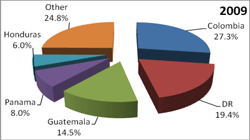
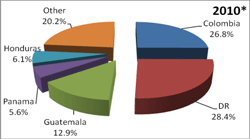
Based on data, total US export volumes of MSC (HS1602320035) rose 23 per cent (25,014 metric tons; MT) in the first five months of 2010 from 2009 levels (20,309MT). The US exported 4,936MT in May 2010 (+40 per cent) from May 2009 (3,527MT). To date, the Dominican Republic is the top destination of US MSC by volume in 2010 surpassing Colombia’s 2009 lead. Significant export increases were noted to the Philippines in 2010 versus 2009.
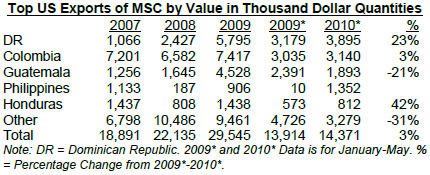
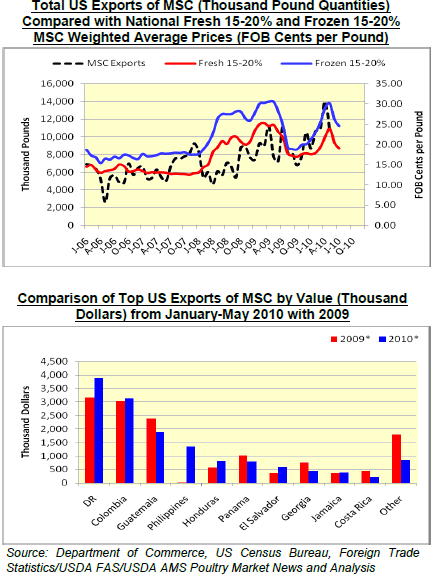
Total US MSC exports from January-May 2010 were $14,371,000 (3.0 per cent higher than the same period a year ago at $13,914,000). In May 2010, the US exported a total of $3,375,000 of MSC, which was 37 per cent higher than May 2009 ($2,464,000). By value in 2010, the US’s top export market for MSC continues to be to the Dominican Republic ($3,895,000) with Colombia ($3,140,000) following close behind.
MSC production shifts were noted in 2010 due to a variety of reasons: plant closures, added MSC operations, fires, high rendering values and others. More production changes are anticipated in 2011. Some processors have indicated reduced finished product sales in 2010. Present trading levels for MSC on the spot marketplace are seasonally declining as industry prepares for the last US summer holiday (Labor Day) and the start of 2011 annual contract negotiations. In 2010, a larger percentage of production was contracted like in years past; whereas in 2008-2009 less was contracted as many opted to sell more on the spot marketplace. In 2010, Mexico contracted less as a result of high asking prices and many wonder about their strategy in 2011.
| Comparison of top US exports of MSC in 2009 by volume and destination (percentage of total US MSC Exports) |
 |
 |
 |
 |
| Note: DR = Dominican Republic. |
Further Reading


