CME: Pattern for Broilers; High Meat, Poultry Supplies
US - The seasonal pattern for US broiler laying flock inventories was pretty clear back in the “grow and grow some more” days — a clear bottom in the fourth quarter and rather decisive growth into late spring or early summer, write Steve Meyer and Len Steiner. 28 February 2011
 4 minute read
That pattern was obviously shaken by the run-up in feed costs and consequent losses the sector suffered in 2008 and 2009 but the successes of early 2010 pointed to a return to the good old days for the broiler industry. In fact, the end of 2009 and first three quarter of 2010 looked remarkably like the seasonal patterns of those halcyon days. And then cam high corn prices again.
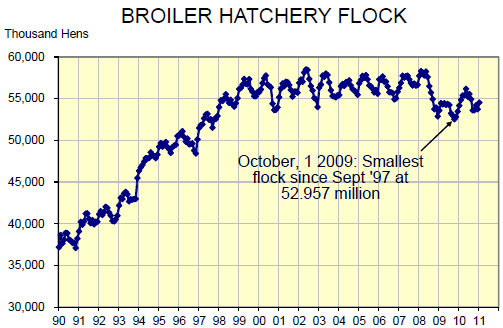
The seasonal pattern since October has been nothing like
normal and January’s data, published in Friday’s Chickens and
Eggs report from USDA confirms that the brakes have been applied
rather abruptly. The 1 January inventory of broiler-type layers was
54.52 million, 1.5 per cent larger than the inventory on 1 December but
only 0.7 per cent higher than one year earlier. That follows a 1 December
inventory that was actually smaller than that of 1 November (not
terribly unusual) and only 0.5 per cent higher than one year earlier. Those
two months marked the lowest year-on-year changes since the
actual year-on-year decline of the flock in November 2009 and are a marked slow-down from growth rates of 3-3.5 per cent earlier in ‘10.
The reason, of course, is losses. Sharply higher feed costs and chicken prices more or less commensurate with higher output
levels caused red ink to once again flow for chicken companies. The slowdown of production increases — there have been no real reductions
yet — will push prices higher eventually but, just as for everyone else, substantial risk remains. We expect the seasonal increase
of broiler hen numbers to be very muted and, perhaps, non-existent this year.
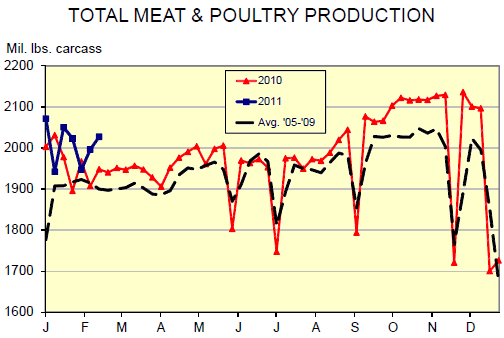
Total meat and poultry supplies have been higher in
five of the seven week for which we have data so far in 2011.
The weekly figures appear in the chart below. Total meat and
poultry output for the week that ended February 16 was 2.027 billion
pounds carcass/ready-to-cook weight. That compares to 1.948
billion in the same week last year, an increase of 4.1 per cent. Total YTD
production stands at 14.058 billion pounds, 2.4 per cent higher than at the
same point in 2010. Note that these figures are based on weekly
data but that data should agree very closely with USDA’s YTD data
from daily data give that New Year’s Day fell on Saturday this year.
Meat (beef, pork, veal and lamb) production for the week of 2/16
was 942 million pounds, 2.5 per cent higher than last year. The YTD total
for those four species is 7.581 billion pounds, 1.5 per cent more than last
year. It should be noted that January lamb and veal production
were RECORD LOW for January. Poultry (broilers, turkeys, light
and heavy hens) production amounted to 1.08 billion pounds last
week, 5.2 per cent higher than last year. YTD poultry output is 3.2 per cent higher
than last year at 7.42 billion pounds ready-to-cook weight.