CME: Only Small Changes for Corn, Soy & Wheat
US - USDA’s monthly Crop Production and World Agricultural Supply and Demand Estimates (WASDE) for December
contained only small changes for US corn, soybeans and wheat, write Steve Meyer and Len Steiner.
The report was about as expected by market analysts and about normal for December, a month in which there is usually no big new news and one that typically looks forward to USDA’s first quarterly estimate of grain stocks – and thus, corn and soybean usage – for the new crop year. That report will not be published until 12 January. Supply and utilisation data for US corn and wheat appear in the tables on page 2 (see full report).
USDA made no changes in its estimates of 2011-2012 supplies for any of the three major crops, leaving all acreage, yield and production estimates the same as in November. Several relatively small changes were made in usage estimates – primarily for exports. These, in turn, drove changes in estimated year-end stocks and stocks/use ratios. Some specifics are:
Estimated corn usage for feed/residual and ethanol were held constant from November. The feed/residual estimate of 4.6 billion bushels is still four per cent lower than last year. When combined with slightly lower DDGS output due to a 0.4 per cent reduction in ethanol usage, this drop represents about a four per cent drop it total cornbased feed ingredient availability. Further, the December WASDE indicates significantly lower amounts of grain sorghum, barley and oats are expected to be used for feed this crop year. Will reductions in chicken and cattle numbers offset expected higher hog numbers by enough to meet these lower feed/ residual figures?
Projected year-end corn stocks are increased by five million bushels but the stocks/use ratio remains roughly the same at 6.7 per cent. USDA lowered its estimate of the national weighted average farm price to 30 cents on each end of the range. Readers are reminded that this price is computed as monthly corn marketings times monthly average price. With lower prices already included for sales in October and, especially, November, this forecast HAD to decline. The mid-point, $6.40, remains well above CME Corn futures prices at present.
Forecast year-end wheat stocks were raised by 50 million bushels due to a reduction in forecast US wheat exports. The expected 878 million bushels of year-end stocks represents about 42 per cent of total annual usage. As can be seen in the table, the wheat market always carries a lot more product over than do either corn or soybeans. Running out of feed is one thing but running out of bread is quite another! Foreign production is the driver in this market. World wheat stocks are the largest in over a decade. Note that USDA’s forecast price range of $7.05 to $7.55 is also much higher than current futures prices, especially in Chicago, and most likely reflect high levels of summer wheat sales. Comparing Chicago wheat futures prices with Chicago corn futures prices suggests that soft wheat will remain a feed ingredient in some areas depending on basis levels.
Projected year-end stocks of soybeans were increased from 195 to 230 million bushels in this report, a move that pushed the year-end stocks/use ratio to 7.6 per cent — its highest level since 2006 -2007. No surprise that USDA knocked nearly a dollar off both ends of its projected soybean price range for the year. The midpoint of that range ($11.70/bushel) is still higher than the 2010-2011 national weighted average price.
Note, though, that the midpoints of the ranges of both soybean products are lower than last year with soybean meal prices now forecast to be sharply lower. That is a good thing for livestock and poultry producers but not a good harbinger for crushers. Is the 10 million bushel decline in crush enough given those economics? The forecast changes in various corn uses continue to drive changes in the share of corn used by competing users.
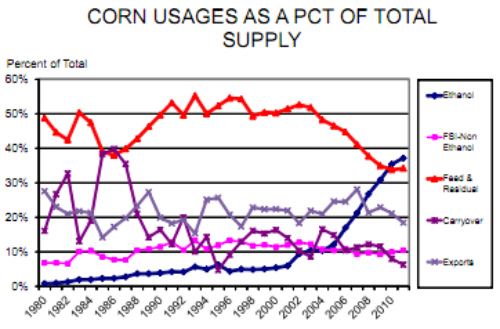
As can be seen below, last year saw ethanol become the largest corn user in terms of both bushels and share for the first time ever. That lead is forecast to increase this year as ethanol take 37.2 per cent of total corn supply. Feed/residual’s share actually increases this year as well even though its total bushels falls. The biggest reason is a 3.3 per cent reduction in the share of corn supply projected to be exported in 2011-12. Carryover stocks’ share of total usage also falls this year by 1.6 per cent. As has been the case for many years, non-ethanol food, seed and industrial use (primarily high-fructose corn syrup) will still use about 10 per cent of al corn.
As anticipated, pork and beef exports were excellent in October. October pork exports were the second highest on record and 24 per cent higher than last year. October beef exports were 10 per cent higher than last year and put 2011 YTD shipments at +24 per cent vs. 2010. The values of pork and beef exports through October are higher than in any entire year in history. Around $4.93 billion of pork and $4.49 billion of beef have been exported with two months yet to go in 2011.
Further Reading
Further Reading


 13 December 2011
 5 minute read
 By:
By: