CME: Crop Plantings, Restaurant Performance Up
US - The apparent meat and poultry demand doldrums of March had little to do with the restaurant sector as the National Restaurant Association’s (NRA) Restaurant Performance Index rose to its highest level since before the onset of the Great Recession, report Steve Meyer and Len Steiner. 1 May 2012
 4 minute read
 By:
By:
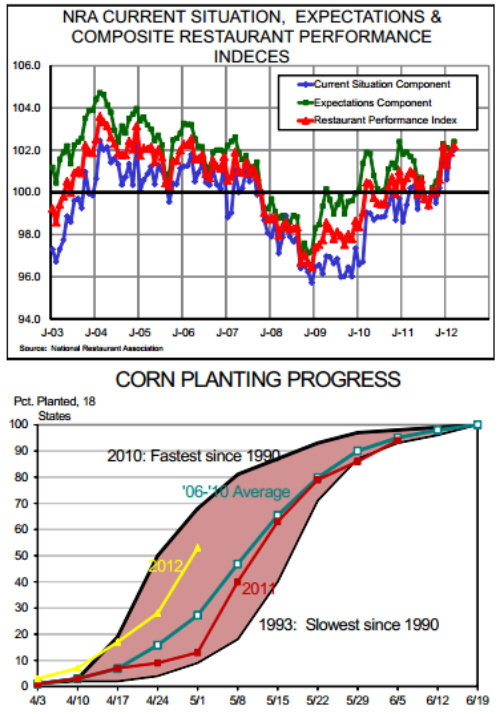
The index rose 0.3 points in March to reach 102.2.
That is same figure as December 11 before the index dipped sharply in January. The December and March levels are the highest
since March 2007. The index bottomed in late 2008 at just over 96.
The index is constructed to make 100 the dividing line
between expansion and contraction. March’s results mark the 7th
straight month of expansionary index levels. That’s the longest
string of expansionary months since before the recession. The
chart at right shows the monthly indexes back to January 2003.
Note that the Restaurant Performance Index is a composite of a Current Situation and Expectations components. Since
mid-2011, the Current Situation component has been as much of a
positive driver of the index as the Expectations component. That is
in sharp contrast to the component drivers during the recession
when Expectations were the primary driver. It is good that restaurant owners are optimists, we suppose, but it is far better when
actual results are matching their outlooks!
According to NRA’s press release, the March Current Situation strength was driven by “solid majorities of operators reporting
higher same-store sales and higher customer traffic levels in
March.” 65 percent of survey respondents reported higher samestore sales in March 2012 versus March 2011. Only 21% reported
lower sales this year.
Crop planting by U.S. farmers continued at a brisk clip
last week even though some activities were interrupted by rain
--at least some of which was very welcome! USDA’s weekly
Crop Progress report showed that 53% of the nation’s corn acres
were planted as of April 29. That figure compares to 27% at the
same time last year and an average of 27% over the past 5 years.
The weekly progress for this year, last year and the past 5 years
appear on the chart at right as well as the progress figures for the
fastest-planted corn crop (2010) and the slowest-planted corn crop
(1993) since 1990. This week’s national 53% figure is the second
highest on record, second only to the 68% of 2010. It is 1% higher
than the 52% planting paces of 2005 and 2006.
Every one of the 18 states that are estimated in the report
are ahead of their 5-year average progress for this point in the season. Most notable are Illinois at 79% planted (vs. 10% last year
and a 5-year average of 29%), Indiana at 70% (vs. 2% last year
and 20% average over the past 5 years) and Ohio at 57% after
being only 1% planted last year amid rain, rain and more rain.
Even the northern-tier states are well ahead of schedule with Iowa
at 50% (vs. an average of 32%), Minnesota at 48% (vs. 31% average) and North and South Dakota at 24% and 31%, respectively.
The report indicates that one –quarter of the nation’s corn
acres were seeded last week. Using the Planting Intentions number of 95.8 million acres, that means 24 million acres were planted — or nearly 3.5 million per day. That pace matches what we saw
last year after May 1.
Soybean planting is just getting underway in most areas
but the national figures are, like corn, well ahead of most previous
years. 12% of the intended acres have been planted in the 18 surveyed states. That compares to 2% last year and 5% over the past
5 years. As expected, the southern states are well along in soybean planting. Illinois, Indiana and Ohio have 13%, 28% and 16%
of the intended soybean acres planted as of Sunday.
NOAA’s 5-day precipitation forecast says the pace may
slow somewhat this week.
Further Reading
| - | You can view the full report by clicking here. |