GLOBAL POULTRY TRENDS - Asia Accounts for a Third of Chicken Meat Output
Although the forecast growth for poultry meat production to 2024 has been revised downwards from 2.25 per cent per year to 2.0 per cent by the Organisation for Economic Co-operation and Development (OECD) in conjunction with the Food and Agriculture Organisation (FAO), global poultry meat production will still become the largest meat sector in 2021, writes poultry market analyst Terry Evans. 8 October 2015
 9 minute read
 By:
By: By 2024 output is forecast to amount to almost 134 million tonnes, which compares with a little under 129 million tonnes for pig meat, 75 million tonnes for beef and veal and 17 million tonnes for sheep meat.
For 2015 the FAO forecasts world poultry meat production to amount to almost 112 million tonnes, reflecting an increase of only 1.4 per cent on 2014 and contrasting markedly with an annual growth rate of some three per cent in the previous 10 years.
According to FAO’s Food Outlook Report, while falling feed prices have stimulated growth in many countries, industry challenges, and particularly in China where concerns over avian influenza have caused poultry demand to stagnate, have applied a brake to expansion. Consequently, the FAO considers that poultry meat production in China will be unchanged this year at around 18.5 million tonnes.
As a generalisation, chicken meat represents between 88-89 per cent of global poultry meat production.
Reference to table 1 shows that, during the period 2000 to 2013, chicken meat output grew at almost four per cent per year from 58.7 million tonnes to 96.3 million tonnes.
| Table 1: Indigenous* chicken meat production (million tonnes) | ||||||||||||
| Region | 2000 | 2005 | 2006 | 2007 | 2008 | 2009 | 2010 | 2011 | 2012 | 2013 | 2014E | 2015F |
|---|---|---|---|---|---|---|---|---|---|---|---|---|
| Africa | 2.8 | 3.3 | 3.4 | 3.7 | 4.0 | 4.2 | 4.5 | 4.5 | 4.6 | 4.7 | 4.9 | 4.9 |
| Americas | 27.1 | 32.7 | 33.7 | 35.0 | 37.5 | 36.9 | 38.8 | 40.0 | 40.5 | 42.1 | 42.8 | 43.4 |
| Asia | 18.6 | 22.4 | 23.5 | 25.0 | 26.2 | 28.0 | 29.2 | 30.3 | 31.6 | 32.2 | 32.1 | 32.7 |
| Europe | 9.5 | 10.9 | 10.8 | 11.6 | 12.1 | 13.3 | 13.9 | 14.6 | 15.5 | 16.1 | 16.5 | 16.7 |
| Oceania | 0.7 | 0.9 | 1.0 | 1.0 | 1.0 | 1.0 | 1.1 | 1.2 | 1.2 | 1.3 | 1.2 | 1.3 |
| WORLD | 58.7 | 70.3 | 72.3 | 76.2 | 80.7 | 83.4 | 87.4 | 90.6 | 93.3 | 96.3 | 97.5 | 99.0 |
| Broiler meat production (million tonnes) | ||||||||||||
| WORLD | 50.1 | 63.1 | 64.3 | 68.3 | 72.8 | 73.6 | 78.2 | 81.4 | 83.4 | 84.6 | 86.4 | 87.3 |
| *Meat from the slaughter of birds originating in a country, plus the meat equivalent of any such birds exported live. | ||||||||||||
| E 2014 and F 2015 author's estimates and forecasts for chicken meat, F 2015 USDA forecast for broiler meat. | ||||||||||||
| Regional figures may not add up to the world totals due to rounding. | ||||||||||||
| Sources: FAO for chicken meat, USDA for broiler meat. | ||||||||||||
From 2000 to 2015 the rate of increase looks to have been around 3.6 per cent, slowing to 2.5 per cent between 2010 and 2015, while the rise this year over 2014 could well be just 1.5 per cent.
As a result, it looks as though chicken meat output in 2015 will amount to around 99 million tonnes, while 100 million tonnes is sure to be surpassed in 2016.
Production in Africa is close to 5 million tonnes a year, while for the Americas it looks certain to exceed 43 million tonnes this year.
Output in Asia is approaching 33 million tonnes, while in Europe the total is close to 17 million tonnes. It should be noted that these chicken meat figures include estimates for commercial and backyard production plus the meat from culled layers.
The number of chickens killed in 2013 totalled almost 61,300 million which was 20,664 million (51 per cent) more than the 40,634 million slaughtered in 2000. For Asia the corresponding figures were 25,127 million and 14,687 million showing a rise of 10.4 million (71 per cent).
Eviscerated weights improved over the review period, the global average rising from 1.44 to 1.57kg per bird. The relevant figures for Asia showed just a small increase from 1.26 to 1.28kg. Putting these figures into perspective the average for the Americas went up from 1.67kg to 1.98kg per bird.
The United States Department of Agriculture (USDA) makes estimates of what it considers to be broiler meat production in selected countries. Their world totals approximate to between 88-89 per cent of global chicken meat production. For 2015 their forecast is 87.3 million tonnes (Table 1).
Chicken meat production in Asia expanded by 4.3 per cent per year from 18.6 million tonnes in 2000 to 32.2 million tonnes in 2013 (Tables 1 and 2 and figure 1). During this period this region increased its share of the global total from 31.7 per cent to 33.4 percent. In 2013 Asia had ten countries producing more than a million tonnes of chicken meat a year (Table 3), their combined output totalling almost 27 million tonnes, which represented 84 per cent of the regional figure. Back in 2000 this group accounted for 82 per cent of national output.
| Table 2: Indigenous chicken meat production in Asia ('000 tonnes eviscerated weight) | ||||||||||||
| Country | 2000 | 2005 | 2009 | 2010 | 2011 | 2012 | 2013 | |||||
|---|---|---|---|---|---|---|---|---|---|---|---|---|
| Afghanistan | 13.2 | 30.4 | 20.0 | 24.9 | 21.8 | 23.9 | 23.7 | |||||
| Armenia | 0.4 | 3.9 | 2.9 | 4.9 | 4.3 | 5.6 | 5.5 | |||||
| Azerbaijan | 16.2 | 31.8 | 65.6 | 62.8 | 69.1 | 86.8 | 95.0 | |||||
| Bahrain | 0.6 | 0.6 | 0.8 | 0.8 | 0.8 | 0.8 | 6.3 | |||||
| Bangladesh | 92.9 | 129.9 | 156.0 | 160.1 | 165.2 | 170.6 | 171.9 | |||||
| Bhutan | 0.2 | 0.3 | 0.3 | 0.3 | 0.3 | 0.4 | 0.4 | |||||
| Brunei Darussalam | 10.5 | 7.5 | 18.9 | 20.0 | 22.1 | 23.0 | 25.7 | |||||
| Cambodia | 19.5 | 17.2 | 22.9 | 19.5 | 18.9 | 18.9 | 17.4 | |||||
| China, Hong Kong | - | - | - | - | - | - | - | |||||
| China, Macao | 1.2 | 1.3 | 1.3 | 1.3 | 1.1 | 1.2 | 1.2 | |||||
| China, mainland | 8426.9 | 9399.3 | 11170.9 | 11598.5 | 11968.5 | 12629.2 | 12790.8 | |||||
| China, Taiwan Prov | 630.6 | 554.7 | 541.5 | 557.7 | 588.9 | 543.7 | 554.5 | |||||
| Cyprus | 31.6 | 32.8 | 27.0 | 26.9 | 26.7 | 24.8 | 23.4 | |||||
| Georgia | 13.9 | 16.2 | 11.2 | 10.2 | 10.7 | 10.1 | 8.5 | |||||
| India | 865.4 | 1403.1 | 2086.8 | 2193.1 | 2235.1 | 2277.9 | 2328.3 | |||||
| Indonesia | 806.6 | 1125.1 | 1404.4 | 1539.5 | 1664.8 | 1734.0 | 1837.8 | |||||
| Iran Isl Rep | 804.0 | 1245.9 | 1997.5 | 1875.4 | 1913.5 | 1956.3 | 1962.3 | |||||
| Iraq | 73.7 | 84.1 | 33.1 | 48.2 | 81.6 | 84.8 | 85.6 | |||||
| Israel | 270.1 | 369.8 | 435.6 | 449.4 | 458.2 | 481.7 | 442.5 | |||||
| Japan | 1193.0 | 1271.1 | 1412.4 | 1415.6 | 1376.5 | 1443.1 | 1448.5 | |||||
| Jordan | 118.1 | 132.2 | 154.8 | 188.4 | 191.9 | 191.7 | 197.5 | |||||
| Kazakhstan | 32.9 | 43.7 | 73.1 | 98.5 | 96.5 | 114.7 | 127.5 | |||||
| Korea Dem Peo Rep | 26.8 | 35.8 | 31.9 | 31.9 | 31.9 | 33.0 | 33.0 | |||||
| Korea Rep | 373.3 | 483.6 | 550.4 | 587.6 | 616.2 | 597.5 | 615.5 | |||||
| Kuwait | 31.1 | 31.4 | 40.9 | 40.3 | 38.6 | 39.6 | 40.1 | |||||
| Kyrgyzstan | 4.6 | 5.4 | 4.0 | 4.0 | 6.0 | 5.9 | 6.0 | |||||
| Lao Peo Dem Rep | 9.6 | 15.4 | 17.4 | 19.3 | 19.9 | 20.3 | 20.3 | |||||
| Lebanon | 104.2 | 121.3 | 128.6 | 78.4 | 93.2 | 98.5 | 83.5 | |||||
| Malaysia | 713.9 | 916.1 | 1129.8 | 1213.9 | 1249.8 | 1285.0 | 1367.4 | |||||
| Mongolia | 0.1 | 0.2 | 0.2 | 0.2 | 0.1 | 0.1 | 0.1 | |||||
| Myanmar | 212.4 | 560.4 | 922.9 | 1015.6 | 1078.7 | 1079.7 | 1081.9 | |||||
| Nepal | 12.6 | 15.3 | 16.5 | 16.5 | 36.1 | 40.3 | 42.8 | |||||
| Occ Pal Ter | 68.3 | 65.0 | 47.3 | 52.0 | 52.0 | 52.0 | 52.0 | |||||
| Oman | 4.2 | 5.8 | 5.4 | 5.6 | 5.6 | 5.8 | 6.0 | |||||
| Pakistan | 327.3 | 385.4 | 650.3 | 706.0 | 768.0 | 834.3 | 908.8 | |||||
| Philippines | 531.8 | 648.6 | 826.0 | 868.2 | 920.6 | 984.3 | 1046.4 | |||||
| Qatar | 4.2 | 5.3 | 7.3 | 7.3 | 9.2 | 9.8 | 10.0 | |||||
| Saudi Arabia | 482.1 | 536.5 | 566.6 | 576.8 | 576.3 | 572.3 | 581.3 | |||||
| Singapore | - | - | - | - | - | - | - | |||||
| Sri Lanka | 62.7 | 96.7 | 99.0 | 102.0 | 102.1 | 102.8 | 106.0 | |||||
| Syrian Arab Rep | 106.0 | 160.4 | 182.2 | 188.9 | 177.2 | 150.5 | 142.1 | |||||
| Tajikstan | 0.1 | 0.1 | 4.2 | 0.1 | 1.7 | 7.0 | 0.8 | |||||
| Thailand | 1051.0 | 1006.6 | 1152.0 | 1218.9 | 1241.4 | 1319.1 | 1377.9 | |||||
| Timor - Leste | 1.0 | 0.7 | 0.8 | 0.7 | 0.7 | 0.8 | 0.8 | |||||
| Turkey | 634.9 | 943.2 | 1317.9 | 1449.2 | 1613.4 | 1724.0 | 1758.5 | |||||
| Turkmenistan | 6.0 | 14.0 | 19.5 | 19.5 | 20.0 | 21.0 | 21.3 | |||||
| United Arab Emirates | 25.0 | 34.3 | 37.8 | 39.6 | 40.5 | 41.1 | 42.3 | |||||
| Uzbekistan | 15.7 | 20.9 | 24.1 | 25.9 | 30.0 | 29.3 | 32.3 | |||||
| Viet Nam | 294.5 | 320.9 | 526.9 | 454.8 | 492.1 | 523.7 | 527.7 | |||||
| Yemen | 65.2 | 112.3 | 137.7 | 143.7 | 149.1 | 151.0 | 150.6 | |||||
| ASIA | 18590.0 | 22442.3 | 28084.3 | 29163.0 | 30286.6 | 31552.2 | 32209.6 | |||||
| - less than 50 tonnes | ||||||||||||
| Source: FAO | ||||||||||||
| Table 3: Indigenlous chicken meat production ranking in Asia in 2013 ('000 tonnes) | ||||||||||||
| China, mainland | 12790.8 | |||||||||||
|---|---|---|---|---|---|---|---|---|---|---|---|---|
| India | 2328.3 | |||||||||||
| Iran Isl Rep | 1962.3 | |||||||||||
| Indonesia | 1837.8 | |||||||||||
| Turkey | 1758.5 | |||||||||||
| Japan | 1448.5 | |||||||||||
| Thailand | 1377.9 | |||||||||||
| Malaysia | 1367.4 | |||||||||||
| Myanmar | 1081.9 | |||||||||||
| Philippines | 1046.4 | |||||||||||
| Pakistan | 908.8 | |||||||||||
| Korea Rep | 615.5 | |||||||||||
| Saudi Arabia | 581.3 | |||||||||||
| China, Taiwan Prov | 554.5 | |||||||||||
| Viet Nam | 527.7 | |||||||||||
| Israel | 442.5 | |||||||||||
| Jordan | 197.5 | |||||||||||
| Bangladesh | 171.9 | |||||||||||
| Yemen | 150.6 | |||||||||||
| Syrian Arab Rep | 142.1 | |||||||||||
| Kazakhstan | 127.5 | |||||||||||
| Sri Lanka | 106.0 | |||||||||||
| Azerbaijan | 95.0 | |||||||||||
| Iraq | 85.6 | |||||||||||
| Lebanon | 83.5 | |||||||||||
| Occ Pal Ter | 52.0 | |||||||||||
| Nepal | 42.8 | |||||||||||
| United Arab Emirates | 42.3 | |||||||||||
| Kuwait | 40.1 | |||||||||||
| Korea Dem Peo Rep | 33.0 | |||||||||||
| Uzbekistan | 32.3 | |||||||||||
| Brunei Darussalam | 25.7 | |||||||||||
| Afghanistan | 23.7 | |||||||||||
| Cyprus | 23.4 | |||||||||||
| Turkmenistan | 21.3 | |||||||||||
| Lao Peo Dem Rep | 20.3 | |||||||||||
| Cambodia | 17.4 | |||||||||||
| Qatar | 10.0 | |||||||||||
| Georgia | 8.5 | |||||||||||
| Bahrain | 6.3 | |||||||||||
| Oman | 6.0 | |||||||||||
| Kyrgyzstan | 6.0 | |||||||||||
| Armenia | 5.5 | |||||||||||
| China, Macao | 1.2 | |||||||||||
| Timor - Leste | 0.8 | |||||||||||
| Tajikstan | 0.8 | |||||||||||
| Bhutan | 0.4 | |||||||||||
| Mongolia | 0.1 | |||||||||||
| Source: FAO | ||||||||||||
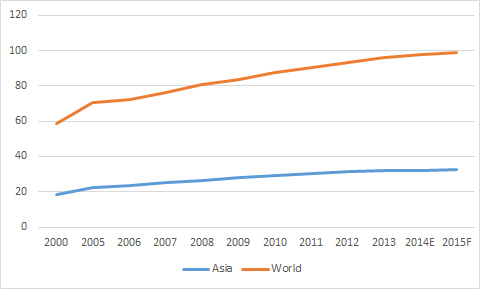
Figure 1. Asia accounts for a third of world chicken meat output (million tonnes).
This ranking of chicken meat producing countries not surprisingly places mainland China as the leader with an output of 12.8 million tonnes in 2013 or almost 40 per cent of the regional total. According to FAO estimates on poultry meat output, production in China this year will be identical to 2014.
However, the broiler output data presented by the USDA (Table 4 and figures 2 and 3) indicate a production cutback in China in 2013 and 2014, but a small recovery in 2015. Of note is that these figures have been consistently higher than the FAO’s chicken meat data, which underscores the point that statistical series often differ in absolute terms according to source, though usually the trends over time are similar.
| Table 4: Leading broiler meat producers in Asia ('000 tonnes) | ||||||||||||
| Country | 2000 | 2005 | 2006 | 2007 | 2008 | 2009 | 2010 | 2011 | 2012 | 2113 | 2014 | 2015F |
|---|---|---|---|---|---|---|---|---|---|---|---|---|
| China | 9269 | 10200 | 10350 | 11291 | 11840 | 12100 | 12550 | 13200 | 13700 | 13350 | 13080 | 13110 |
| India | 1080 | 1900 | 2000 | 2240 | 2490 | 2550 | 2650 | 2900 | 3160 | 3450 | 3725 | 3900 |
| Turkey | 662 | 978 | 946 | 1012 | 1170 | 1250 | 1420 | 1619 | 1707 | 1924 | 1956 | 1990 |
| Thailand | 1070 | 950 | 1100 | 1050 | 1170 | 1200 | 1280 | 1350 | 1550 | 1500 | 1570 | 1640 |
| Indonesia | 804 | 1126 | 1260 | 1295 | 1350 | 1409 | 1465 | 1515 | 1540 | 1550 | 1565 | 1625 |
| Malaysia | 730 | 980 | 1035 | 1100 | 1163 | 1202 | 1296 | 1334 | 1375 | 1416 | 1440 | 1460 |
| Japan | 1091 | 1166 | 1258 | 1250 | 1255 | 1283 | 1295 | 1252 | 1326 | 1337 | 1360 | 1360 |
| F forecast | ||||||||||||
| Chicken paws are excluded, - no figure | ||||||||||||
| Source: USDA | ||||||||||||
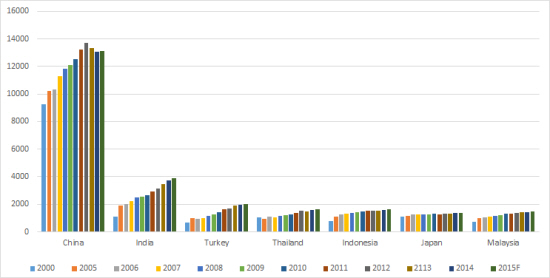
Figure 2. India's broiler industry has shown the fastest growth, closely followed by Turkey.
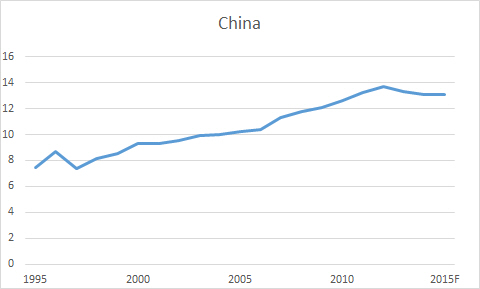
Figure 3. Broiler production in China has slowed in recent years (million tonnes)
The second largest producer in the region is India. This country’s industry has escalated at around a massive eight per cent per year as output has climbed from 865,000 tonnes in 2000 to 2.3 million tonnes in 2013.
Although the rate of expansion latterly appears to have slowed down, the USDA broiler figures still point to a growth of more than six per cent per year since 2013 (Figure 4), a rate which it is anticipated will be maintained at least until 2018.
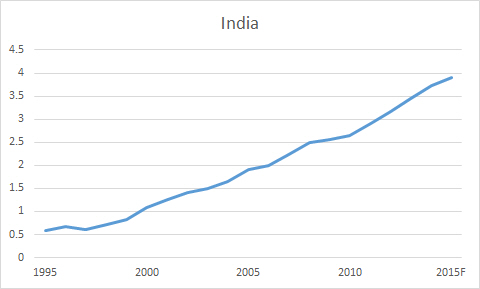
Figure 4. India's industry has shown rapid growth (million tonnes).
According to the FAO and also other official sources, the Islamic Republic of Iran is the third biggest producer of chicken meat in Asia output having risen from just over 800,000 tonnes in 2000 to almost 2 million tonnes in 2013.
Turkey’s industry has also developed rapidly recording growth of well above seven per cent per year between 2000 and this year when production will come close to 2 million tonnes (Figure 5).
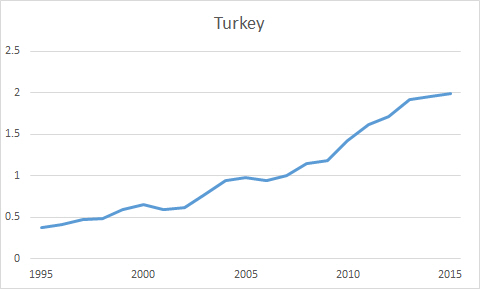
Figure 5. Broiler production in Tukey is close to 2 million tonnes a year.
Thailand’s broiler industry suffered a massive setback in 2004 (Table 4 and figure 6) when, following an outbreak of highly pathogen avian influenza (HPAI), its frozen chicken exports were banned from several countries. Consequently, production slumped by some 440,000 tonnes or 33 per cent. However, by switching to the production of processed chicken products the industry has since been able to show steady growth such that a record output of more than 1.6 million tonnes is forecast for this year.
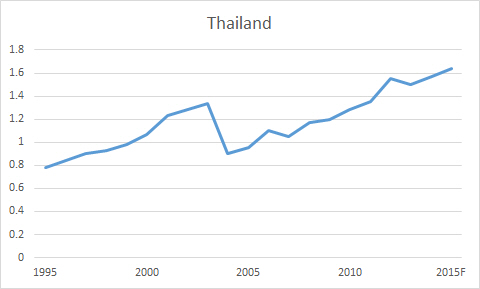
Figure 6. Thailand's recovery is well under way (milllion tonnes).
The industries in both Indonesia and Malaysia have doubled in size since 2000, though expansion in recent years has been small.
In contrast to the other leading producers, Japan’s industry increased by only 1.5 per year during the review period (Figure 7) with output this year expected to be similar to last year.
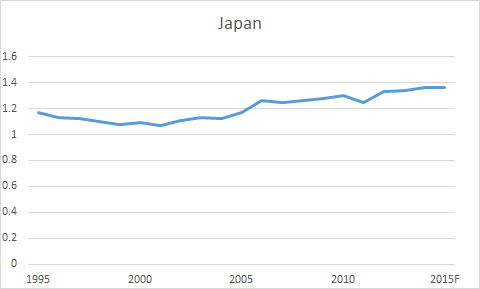
Figure 7. Little growth in broiler production in Japan (million tonnes).
According to the FAO, chicken meat output in the Philippines exceeded a million tonnes in 2013, while the USDA data indicates that broiler production amounted to some 827,000 tonnes in that year and is expected to rise to 900,000 tonnes in 2015.
October 2015