GLOBAL POULTRY TRENDS - Developing Countries Main Drivers in Chicken Consumption
Global poultry meat consumption is rising, and so is consumption in the Americas, with white breast meat preferred by the higher-income consumers, writes poultry industry analyst Terry Evans. 2 February 2016
 7 minute read
 By:
By: The Americas accounted for almost 842 million or 14 per cent of the global human population in 2000.
Since then, although numbers have grown to 991 million in 2015, the region’s share of the total has slipped to 13.5 per cent (Table 9).
Looking further ahead the population of this region is expected to grow by 0.8 per cent per year to 2030. However, the global total is forecast to expand by a shade under 1 per cent per year, hence the Americas as a proportion of this, will decline further to 13.3 per cent and indeed, by 2050, this region’s share will be under 13 per cent.
| Table 9. Human population of the world (millions) | ||||||||||||
|---|---|---|---|---|---|---|---|---|---|---|---|---|
| Region | 2000 | 2010 | 2015 | 2020 | 2030 | 2050 | ||||||
| Number | % | Number | % | Number | % | Number | % | Number | % | Number | % | |
| Africa | 808.3 | 13.2 | 1031.1 | 14.9 | 1166.2 | 15.9 | 1312.1 | 17.0 | 1634.4 | 19.4 | 2393.2 | 25.1 |
| Americas | 841.7 | 13.7 | 942.7 | 13.6 | 991.2 | 13.5 | 1037.5 | 13.5 | 1120.1 | 13.3 | 1227.8 | 12.9 |
| Asia | 3717.4 | 60.7 | 4165.4 | 60.2 | 4384.9 | 59.9 | 4581.5 | 59.4 | 4886.9 | 58.0 | 5164.1 | 54.1 |
| Europe | 729.1 | 11.9 | 740.3 | 10.7 | 743.1 | 10.1 | 743.6 | 9.6 | 736.4 | 8.7 | 709.1 | 7.4 |
| Oceania | 31.2 | 0.5 | 36.7 | 0.5 | 39.4 | 0.5 | 42.1 | 0.6 | 47.3 | 0.6 | 56.9 | 0.6 |
| WORLD | 6127.7 | 100.0 | 6916.2 | 100 | 7324.8 | 100 | 7716.7 | 100.1 | 8424.9 | 100.0 | 9551.0 | 100.0 |
| Source: FAO | ||||||||||||
| Table 10. Poultry meat consumption (kg/person/year) | ||||||||||||
| 2000 | 2001 | 2002 | 2003 | 2004 | 2005 | 2006 | 2007 | 2008 | 2009 | 2010 | 2011 | |
| Africa | 4.3 | 4.4 | 4.5 | 4.7 | 4.7 | 4.7 | 4.8 | 5.2 | 5.5 | 5.6 | 6.1 | 6.2 |
| Americas | 31.5 | 31.8 | 32.8 | 33.1 | 34.7 | 34.1 | 35.3 | 36.0 | 37.1 | 35.9 | 37.6 | 38.5 |
| Asia | 6.6 | 6.6 | 6.7 | 7.0 | 7.0 | 7.4 | 7.6 | 8.1 | 8.5 | 9.0 | 9.2 | 9.4 |
| Europe | 15.9 | 17.8 | 18.5 | 18.2 | 19.0 | 19.2 | 19.2 | 20.2 | 21.3 | 21.7 | 21.4 | 21.7 |
| Oceania | 30.1 | 30.1 | 32.2 | 33.5 | 33.4 | 35.6 | 35.7 | 36.8 | 35.4 | 35.6 | 37.4 | 42.1 |
| WORLD | 11.0 | 11.2 | 11.6 | 11.8 | 12.0 | 12.2 | 12.5 | 13.1 | 13.6 | 13.7 | 14.1 | 14.4 |
| Source: FAO | ||||||||||||
By 2024 an OECD/FAO paper forecasts poultry meat consumption to amount to almost 133 million tonnes, compared with 111 million tonnes in 2015. Uptake in developed countries in 2015 is put at 43.6 million tonnes with 67.5 million tonnes being consumed in developing nations.
By 2024 poultry meat consumption in the developed economies is expected to have risen some 5.2 million tonnes to 48.8 million tonnes, while for the developing nations a 16.7 million tonnes increase is anticipated as the total rises to 84.2 million tonnes.
As a broad rule, chicken meat accounts for around 89 per cent of poultry meat availability, so by 2024 chicken uptake could well be in the region of 118 million tonnes. However, the report warns that weaker economic growth for both developed and developing countries could limit consumption increases, but it asserts that “Rapid population growth and urbanisation within developing regions remains the core driver to total consumption growth.”
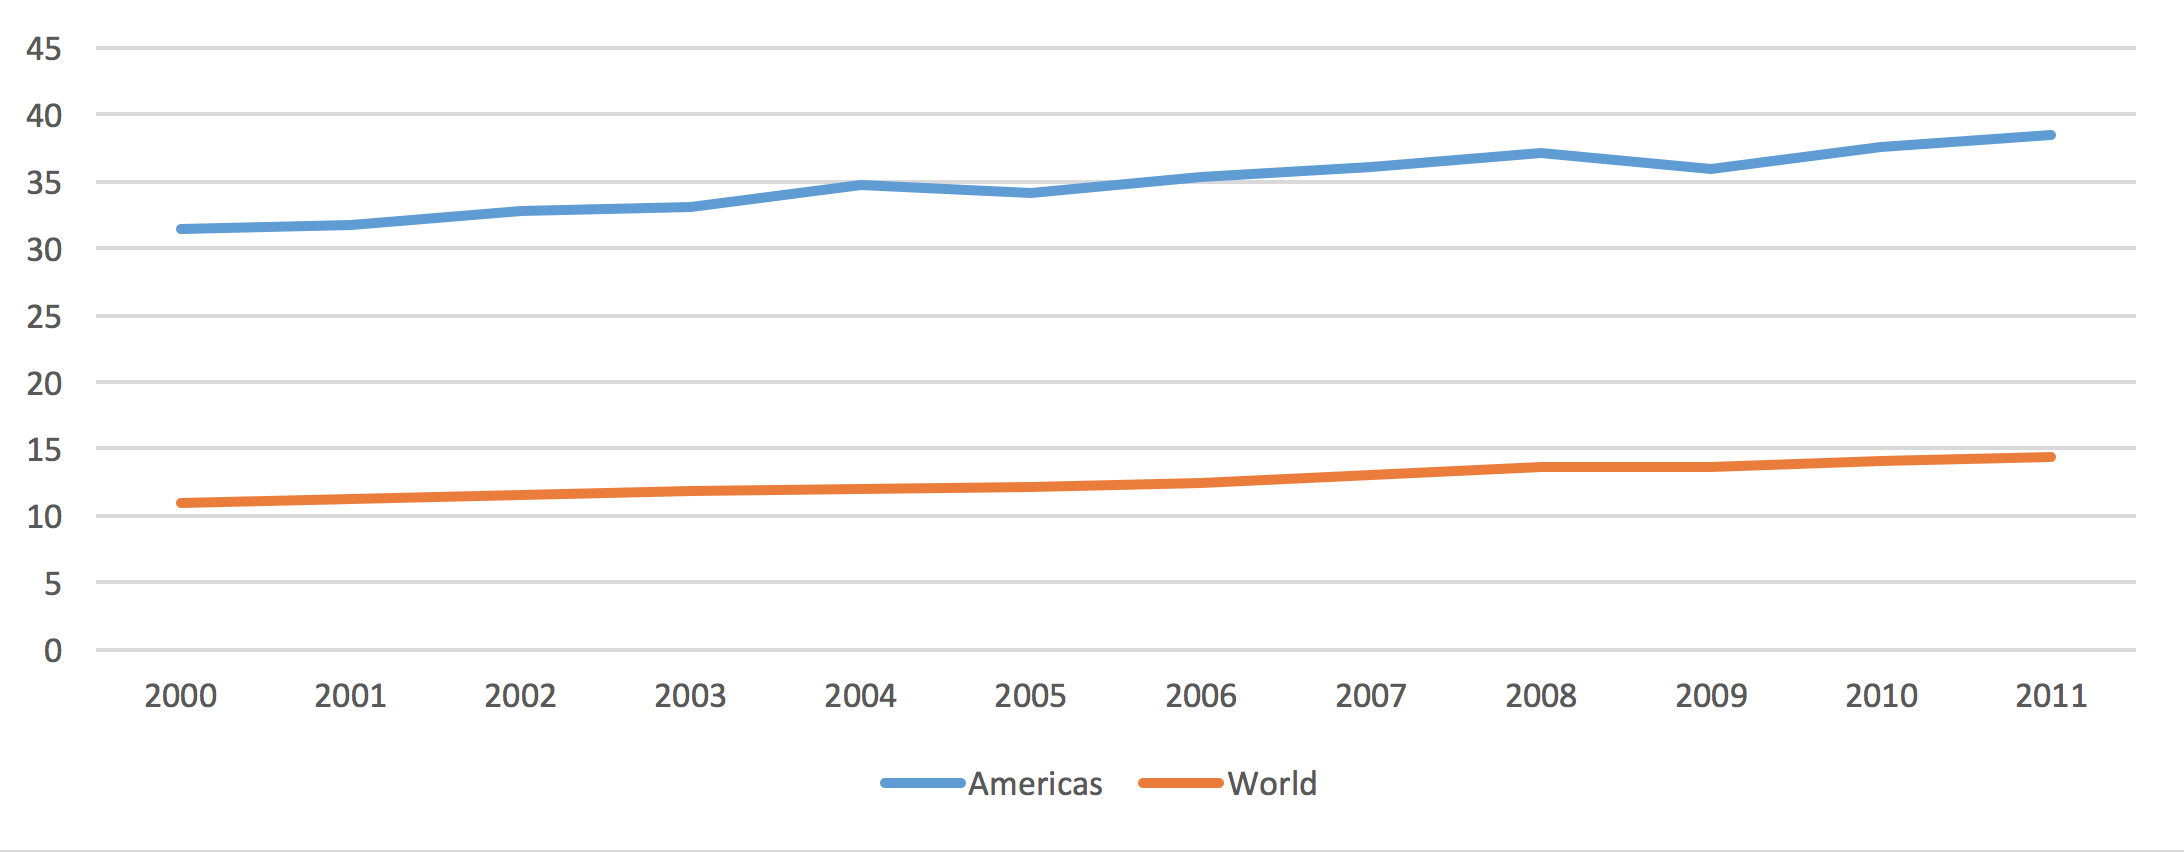
Figure 4. Poultry meat consumption in the Amercias is well above the world average (kg/person/year).
Global poultry meat consumption, according to FAO calculations, has climbed from 11 kg per person per year in 2000 to 14.4kg in 2011 (Table 10 and figure 4). Currently, it looks as though this figure will be around 15.1kg on an eviscerated weight basis.
For the Americas the corresponding figures were 31.5kg and 38.5kg. It should be noted however, that all consumption figures are measures of the quantities of a product that are estimated available to be eaten, rather than measurements of the actual quantities consumed.
The figures for the individual countries in the region (Table 11) show quite wide differences in the average amounts of poultry eaten, and also in the increases that have taken place since 2000.
| Table 11. Human population of the Americas and poultry meat consumption | ||||||||||
|---|---|---|---|---|---|---|---|---|---|---|
| Human population | Poultry meat consumption | |||||||||
| (millions) | (kg/person/year) | |||||||||
| Country | 2000 | 2015 | 2020 | 2030 | 2000 | 2007 | 2008 | 2009 | 2010 | 2011 |
| Anguilla | # | # | # | # | - | - | - | - | - | - |
| Antigua/Barbuda | 0.1 | 0.1 | 0.1 | 0.1 | 49.9 | 54.5 | 55.3 | 55.8 | 56.8 | 58.8 |
| Argentina | 36.9 | 42.2 | 43.8 | 46.9 | 27.8 | 29.0 | 31.6 | 33.5 | 34.6 | 35.3 |
| Aruba | 0.1 | 0.1 | 0.1 | 0.1 | - | - | - | - | - | - |
| Bahamas | 0.3 | 0.4 | 0.4 | 0.5 | 54.0 | 54.2 | 54.4 | 54.9 | 56.2 | 54.8 |
| Barbados | 0.3 | 0.3 | 0.3 | 0.3 | 41.7 | 45.3 | 42.9 | 49.2 | 48.6 | 49.9 |
| Belize | 0.2 | 0.4 | 0.4 | 0.5 | 26.3 | 26.8 | 25.1 | 26.0 | 26.5 | 26.2 |
| Bermuda | 0.1 | 0.1 | 0.1 | 0.1 | 46.1 | 37.8 | 54.3 | 47.9 | 39.7 | 40.3 |
| Bolivia | 8.5 | 11.0 | 11.9 | 13.7 | 16.0 | 29.4 | 30.9 | 32.4 | 37.7 | 36.5 |
| Brazil | 174.5 | 203.7 | 211.1 | 222.8 | 29.6 | 31.7 | 36.6 | 35.0 | 37.7 | 40.6 |
| British Vir Isl | # | # | # | # | - | - | - | - | - | - |
| Canada | 30.7 | 35.9 | 37.6 | 40.6 | 35.9 | 37.5 | 37.6 | 36.5 | 36.7 | 37.1 |
| Cayman Isl | 0.1 | 0.1 | 0.1 | 0.1 | - | - | - | - | - | - |
| Chile | 15.5 | 17.9 | 18.7 | 19.8 | 26.4 | 34.2 | 33.3 | 31.1 | 32.8 | 36.3 |
| Colombia | 39.9 | 49.5 | 52.4 | 57.2 | 13.5 | 21.7 | 23.3 | 23.2 | 24.0 | 23.9 |
| Costa Rica | 3.9 | 5.0 | 5.3 | 5.8 | 18.1 | 24.4 | 23.5 | 24.1 | 22.4 | 21.0 |
| Cuba | 11.1 | 11.3 | 11.2 | 10.9 | 10.8 | 14.9 | 15.9 | 19.8 | 16.1 | 17.1 |
| Dominica | 0.1 | 0.1 | 0.1 | 0.1 | 37.7 | 32.6 | 33.9 | 30.3 | 29.5 | 31.0 |
| Dominican Rep | 8.7 | 10.7 | 11.2 | 12.2 | 24.6 | 34.7 | 31.7 | 34.0 | 35.2 | 33.4 |
| Ecuador | 12.5 | 16.2 | 17.4 | 19.7 | 15.2 | 23.7 | 23.0 | 21.2 | 22.9 | 21.9 |
| El Salvador | 6.0 | 6.4 | 6.6 | 6.9 | 10.5 | 18.1 | 16.2 | 16.5 | 17.4 | 18.3 |
| Falkland Isl | # | # | # | # | - | - | - | - | - | - |
| French Guiana | 0.2 | 0.3 | 0.3 | 0.4 | - | - | - | - | - | - |
| Greenland | 0.1 | 0.1 | 0.1 | 0.1 | - | - | - | - | - | - |
| Grenada | 0.1 | 0.1 | 0.1 | 0.1 | 27.3 | 33.8 | 35.2 | 36.0 | 38.5 | 41.5 |
| Guadaloupe | 0.4 | 0.5 | 0.5 | 0.5 | - | - | - | - | - | - |
| Guatemala | 11.2 | 16.3 | 18.3 | 22.6 | 12.5 | 16.7 | 16.3 | 16.4 | 16.3 | 16.6 |
| Guyana | 0.8 | 0.8 | 0.8 | 0.9 | 31.6 | 32.8 | 31.4 | 36.2 | 33.1 | 35.4 |
| Haiti | 8.6 | 10.6 | 11.3 | 12.5 | 2.8 | 3.4 | 3.4 | 4.1 | 6.0 | 7.6 |
| Honduras | 6.2 | 8.4 | 9.2 | 10.8 | 13.7 | 20.1 | 20.7 | 21.0 | 21.7 | 22.8 |
| Jamaica | 2.6 | 2.8 | 2.9 | 3.0 | 41.2 | 52.7 | 51.5 | 48.8 | 59.2 | 51.3 |
| Martinique | 0.4 | 0.4 | 0.4 | 0.4 | - | - | - | - | - | - |
| Mexico | 103.9 | 125.2 | 132.0 | 143.7 | 21.4 | 27.9 | 28.3 | 28.4 | 29.0 | 29.5 |
| Montserrat | # | # | # | # | - | - | - | - | - | - |
| Netherlands Ant | 0.2 | 0.2 | 0.2 | 0.3 | 67.5 | 54.9 | 62.5 | 63.2 | 71.0 | - |
| Nicaragua | 5.1 | 6.3 | 6.7 | 7.4 | 9.6 | 16.3 | 16.4 | 16.0 | 18.0 | 18.6 |
| Panama | 3.1 | 4.0 | 4.3 | 4.9 | 26.8 | 29.0 | 28.8 | 28.7 | 28.8 | 29.4 |
| Paraguay | 5.4 | 7.0 | 7.6 | 8.7 | 6.5 | 5.1 | 6.1 | 5.8 | 6.1 | 6.3 |
| Peru | 26.0 | 31.2 | 33.1 | 36.5 | 8.1 | 11.1 | 11.1 | 11.2 | 11.6 | 11.5 |
| Puerto Rico | 3.8 | 3.7 | 3.7 | 3.7 | - | - | - | - | - | - |
| Saint Kitts/Nevis | # | 0.1 | 0.1 | 0.1 | 42.0 | 48.2 | 49.0 | 46.4 | 54.5 | 57.7 |
| Saint Lucia | 0.2 | 0.2 | 0.2 | 0.2 | 62.9 | 55.1 | 55.9 | 61.4 | 65.3 | 69.5 |
| Saint Pierre/Miq | # | # | # | # | - | - | - | - | - | - |
| Saint Vincent/Gren | 0.1 | 0.1 | 0.1 | 0.1 | 49.8 | 63.9 | 65.0 | 63.6 | 66.6 | 74.2 |
| Suriname | 0.5 | 0.6 | 0.6 | 0.6 | 28.4 | 31.6 | 32.6 | 31.8 | 37.5 | 35.6 |
| Trinidad/Tobago | 1.3 | 1.4 | 1.4 | 1.3 | 28.4 | 42.6 | 44.1 | 46.8 | 52.5 | 53.8 |
| Turks/Caicos Isl | # | # | # | # | - | - | - | - | - | - |
| USA | 284.6 | 325.1 | 338.0 | 362.6 | 47.4 | 52.7 | 51.6 | 48.8 | 50.9 | 51.4 |
| Uruguay | 3.3 | 3.4 | 3.5 | 3.6 | 16.4 | 14.1 | 20.2 | 18.9 | 19.0 | 23.7 |
| US Virgin Isl | 0.1 | 0.1 | 0.1 | 0.1 | - | - | - | - | - | - |
| Venezuela Bol Rep | 24.4 | 31.3 | 33.4 | 37.2 | 28.4 | 34.0 | 41.2 | 40.4 | 44.0 | 45.2 |
| AMERICAS | 841.7 | 991.2 | 1037.5 | 1120.1 | 31.5 | 36.0 | 37.1 | 35.9 | 37.6 | 38.6 |
| # less than 50,000, - no figure | ||||||||||
| Source: FAO | ||||||||||
In the USA total poultry meat uptake in 2014 was put at 45.6 kg per person on a retail weight basis. This year it is expected to rise to 47.8kg, while the latest forecast for 2016 stands at 48.4kg, according to WASDE reports.
However, it must be noted that retail weight is considered to be around 86 per cent of the wholesale figure. For broilers the 2014 retail weight uptake currently stands at 37.9kg, while the 2015 and 2016 forecasts are put at 40.1kg and 40.5kg respectively.
Also of note is that an increase in the quantities consumed per person does not necessarily mean that the demand for poultry meat, or chicken has grown, as changes in prices have also be taken into account.
The 2015 forecast of broiler consumption per person in Mexico stands at 26.3kg against 25.9 in 2014. High-income consumers prefer the breast/white meat while the dark meat cuts are more popular among lower-income groups. Although broiler prices have trended upward, increasing beef prices will ensure that chicken will continue to be the most affordable source of protein, followed by pork.
Per capita broiler meat uptake in Canada has been stagnant or slightly declining since it peaked in 2007/8. However, according to a Gain Report, this trend was reversed in 2014 such that a forecast for 2016 of 31.1kg shows a marginal increase on the expected 2015 level of 31kg per person.
That Canadian preferences have moved towards chicken is primarily due to a perception that chicken meat is leaner and therefore healthier than other meats.
The growth in fast-food businesses offering a variety of chicken-based meals has been another significant factor boosting demand. Total chicken consumption has almost doubled over the past 30 years. A major factor here has been the country’s population growth of some 39 per cent from 24.5 million in 1980 to around 34 million in 2010.
For all the countries in the Americas, as elsewhere, the key factors boosting the demand for poultry meat and in particular chicken, will be changes in the human population, real incomes (especially among the poorer sectors of the community), chicken prices relative to its competitors and also changing dietary preferences.