GLOBAL POULTRY TRENDS - Costs, Disease, and Lower Demand Hit Turkey Growth
In recent years higher production costs, disease outbreaks and lower consumer demand have made it difficult for the global turkey industry to expand since reaching its peak of almost 5.7 million tonnes in 2012, reports industry analyst, Terry Evans. 10 June 2015
 8 minute read
 By:
By: Indeed, according to the Food and Agriculture Organisation (FAO), output in 2013 at 5.6 million tonnes showed a cutback of 1.5 per cent on the previous year (Table1 and figure 1).
While the estimates for 2014 point to a possible small recovery, the outbreaks of highly pathogenic avian influenza (HPAI) currently hitting turkey flocks in the USA will almost certainly put a damper on growth there which will impact on the global figure as this country accounts for almost half the world total.
Table 1.
| Turkey Meat Production (million tonnes) | ||||||||
| Region | 2000 | 2005 | 2009 | 2010 | 2011 | 2012 | 2013 | 2014E |
|---|---|---|---|---|---|---|---|---|
| Africa | 0.06 | 0.07 | 0.11 | 0.12 | 0.10 | 0.12 | 0.11 | 0.11 |
| Americas | 2.82 | 3.06 | 3.34 | 3.36 | 3.41 | 3.53 | 3.47 | 3.46 |
| Asia | 0.16 | 0.14 | 0.11 | 0.12 | 0.11 | 0.12 | 0.11 | 0.11 |
| Europe | 2.01 | 1.86 | 1.80 | 1.84 | 1.88 | 1.90 | 1.90 | 1.92 |
| Oceania | 0.03 | 0.01 | 0.02 | 0.02 | 0.02 | 0.02 | 0.02 | 0.02 |
| WORLD | 5.08 | 5.15 | 5.39 | 5.46 | 5.53 | 5.68 | 5.60 | 5.62 |
Author's estimates, totals may not add up due to rounding
Source FAO
Figure 1.
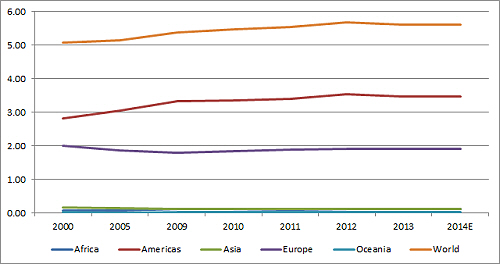
Slow growth in turkey meat production ( million tonnes)
Since 2000 the expansion in turkey meat output has been slow averaging less than one per cent per year. Indeed, a breakdown of the total by regions reveals that only two, Africa and the Americas produced more turkey meat in 2013 than in 2000.
Although Africa recorded a dramatic more than four per cent per year increase between 2000 and 2013, the quantities involved were small having risen from 60,000 tonnes to around 109,000 tonnes when output represented less than two per cent of the world total.
In contrast, while the Americas recorded growth of just 1.6 per cent per year, annual production climbed from 2.8 million tonnes to almost 3.5 million tonnes in 2013, at which point this region accounted for 62 per cent of the global figure.
Production in Asia contracted during this review period and is currently on a par with the figure for Africa.
Although output in Europe has increased since 2009 the total in 2013 was still below the 2000 level of a shade over 2 million tonnes. In 2013 Europe accounted for just over a third of the world total. Note that European Union countries accounted for more than 99 per cent of the Europe figure!
In 2013 the Americas and Europe combined slaughtered some 580 million turkeys or 92 per cent of the world total of 630 million.
However, in these two regions where much greater emphasis is put on marketing cut-up products, the average slaughter weights of around 9kg are much higher than the 5kg or less recorded in Africa, Asia and Oceania. Hence production in the Americas and Europe represents 96 per cent of all turkey meat production.
Out of the 230 or so countries in the world only about a quarter grow turkeys and fewer than 30 produce more than 5,000 tonnes of turkey meat a year.
Table 2 presents the production trends in these countries, the figures relating to indigenous production which is defined as the quantity of meat from slaughterings of home-grown birds plus the meat equivalent from such birds exported live.
Table 2.
| Indigenous Turkey Meat Production (000 tonnes) | |||||||
| Region/Country | 2000 | 2005 | 2009 | 2010 | 2011 | 2012 | 2013 |
|---|---|---|---|---|---|---|---|
| AFRICA | 63.0 | 71.3 | 107.6 | 117.2 | 102.5 | 119.6 | 108.8 |
| Of which: | |||||||
| Egypt | 4.9 | 7.1 | 7.7 | 7.1 | 7.8 | 7.6 | 7.6 |
| Madagascar | 8.4 | 8.4 | 9.0 | 9.2 | 9.4 | 9.4 | 9.2 |
| Morocco | 17.0 | 18.0 | 43.7 | 46.5 | 36.5 | 36.5 | 36.5 |
| South Africa | 3.3 | 5.0 | 5.2 | 5.3 | 5.3 | 5.3 | 5.3 |
| Tunisia | 27.4 | 30.9 | 40.1 | 47.3 | 41.5 | 58.7 | 48.1 |
| AMERICAS | 2820.0 | 3062.6 | 3348.9 | 3357.5 | 3413.0 | 3529.7 | 3469.5 |
| Of which: | |||||||
| Argentina | 34.6 | 35.2 | 35.7 | 35.7 | 35.7 | 35.7 | 35.7 |
| Brazil | 137.0 | 275.1 | 466.2 | 485.0 | 489.0 | 510.0 | 520.0 |
| Canada | 154.0 | 157.8 | 150.0 | 143.1 | 143.7 | 159.2 | 166.4 |
| Chile | 57.7 | 91.9 | 94.9 | 92.5 | 96.9 | 96.9 | 96.9 |
| Mexico | 15.1 | 20.2 | 18.6 | 18.6 | 19.0 | 19.8 | 16.2 |
| USA | 2419.3 | 2480.0 | 2581.0 | 2580.0 | 2626.0 | 2705.4 | 2631.8 |
| ASIA | 163.9 | 138.1 | 114.0 | 124.3 | 112.30 | 114.9 | 105.9 |
| Of which: | |||||||
| Iran Isl Rep | 6.0 | 6.0 | 4.8 | 19.2 | 6.0 | 6.0 | 6.0 |
| Israel | 137.4 | 112.7 | 91.9 | 89.9 | 90.1 | 92.1 | 83.7 |
| Turkey | 11.7 | 1.2 | 12.3 | 10.2 | 11.0 | 11.0 | 11.0 |
| EUROPE | 2006.7 | 1863.9 | 1800.1 | 1840.5 | 1878.5 | 1895.2 | 1890.0 |
| EU | 1993.3 | 1844.6 | 1788.6 | 1830.5 | 1867.7 | 1884.5 | 1878.9 |
| Of which: | |||||||
| Austria | 20.0 | 91.0 | 82.2 | 89.1 | 118.2 | 123.7 | 123.7 |
| Croatia | 6.5 | 8.8 | 7.5 | 5.9 | 5.5 | 5.8 | 5.9 |
| France | 738.0 | 536.0 | 468.0 | 450.0 | 450.0 | 450.0 | 450.0 |
| Germany | 291.8 | 411.1 | 464.7 | 539.5 | 532.4 | 525.7 | 525.7 |
| Hungary | 94.0 | 101.3 | 82.6 | 66.9 | 63.7 | 48.9 | 48.9 |
| Ireland | 31.4 | 30.8 | 23.5 | 24.8 | 24.4 | 24.8 | 25.2 |
| Italy | 327.0 | 299.8 | 305.1 | 298.5 | 315.8 | 338.2 | 338.2 |
| Netherlands | 60.0 | 68.5 | 72.9 | 70.3 | 70.7 | 75.7 | 70.6 |
| Norway | 2.1 | 6.4 | 10.2 | 8.5 | 9.0 | 9.0 | 9.0 |
| Poland* | 11.5 | 10.2 | 60.4 | 58.1 | 50.4 | 50.4 | 50.4 |
| Portugal | 39.3 | 32.6 | 26.5 | 29.5 | 27.8 | 29.2 | 28.3 |
| Slovakia | 52.7 | 15.0 | 13.2 | 10.7 | 8.2 | 8.2 | 8.2 |
| Spain | 10.7 | 6.9 | 7.6 | 10.2 | 10.0 | 10.8 | 10.8 |
| UK | 265.8 | 208.1 | 162.3 | 165.0 | 176.1 | 177.8 | 177.8 |
| OCEANIA | 26.4 | 12.8 | 23.6 | 23.4 | 23.1 | 23.1 | 23.1 |
| Of which: | |||||||
| Australia | 25.2 | 11.6 | 22.2 | 22.1 | 21.7 | 21.7 | 21.7 |
| WORLD | 5079.9 | 5148.7 | 5394.1 | 5463.0 | 5529.3 | 5682.5 | 5596.9 |
Source FAO
There are error factors built into these figures so too much attention should not be paid to small variations from year to year.
In some instances where figures may not be available the FAO has inserted the previous year’s data in order to arrive at regional totals. Although production figures differ depending on the source, more often than not the trends are similar.
The bulk of production comes from just a handful of countries. In 2013, the USA, Germany, Brazil, France, Italy the UK and Canada combined produced some 4.8 million tonnes of turkey meat or 86 per cent of the world total.
It should be noted that while Poland with some 50,000 tonnes does not feature as a significant producer in this FAO data, another source puts Poland’s annual output at around 285,000 tonnes which, if true, would make it the sixth largest producer in the world.
Although the USA is clearly the world’s number one producer, in broad terms, annual output has been rather static at around 2.6 million tonnes (Table 3 and figure 2) since 2009.
Table 3.
| Leading turkey producing countries (000 tonnes) | ||||||||
| Country/region | 2007 | 2008 | 2009 | 2010 | 2011 | 2012 | 2013 | 2014 |
|---|---|---|---|---|---|---|---|---|
| USA | 2664 | 2796 | 2535 | 2527 | 2592 | 2671 | 2599 | 2610 |
| EU | 1790 | 1830 | 1795 | 1946 | 1950 | 2010 | 1950 | 1920 |
| Brazil | 458 | 465 | 466 | 485 | 489 | 510 | 520 | 470 |
| Canada | 170 | 180 | 167 | 159 | 160 | 161 | 168 | 170 |
| Russia | 30 | 39 | 31 | 70 | 90 | 100 | 100 | 105 |
Source USDA
Figure 2.
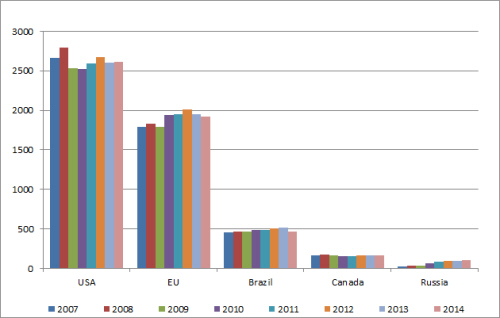
Disappointing growth trend among the leading turkey meat producers ('000 tonnes)
According to World Agricultural Supply and Demand Estimates (WASDE), which reflect US production less condemnations, output in 2012 peaked at 2.67 million tonnes but then fell back to 2.60 million tonnes in 2013 and 2.61 million tonnes in 2014.
In April WASDE forecast US production for 2015 at 2.73 million tonnes, but this was cut to 2.71 million tonnes in May.
However, in view of the outbreaks of HPAI, this figure might be reduced still further before the end of the year. Nevertheless, the forecasters appear confident of a recovery in 2016 projecting a record 2.82 million tonnes, while one long-term forecast to 2023 postulates output in the region of 3.2 million tonnes.
According to FAO data Germany with well over 500,000 tonnes is the second largest turkey meat producer.
Another series of figures published by the Association of Poultry Processors and Poultry Trade (AVEC) in the European Union, points to a much lower level of output well short of 400,000 tonnes for 2013.
Should the AVEC figure be closer to the actual level, then Brazil takes over the number two spot.
Brazil’s industry has grown dramatically from less than 100,000 tonnes prior to 1997 to a peak estimated at 520,000 tonnes in 2013.
However, 2014 witnessed a decline in the demand for turkey meat as it became less competitive against other meats, so output is considered to have eased back to around 470,000 tonnes last year. Nevertheless, despite a sluggish economic outlook, the USA’s Agricultural Marketing Service anticipates five per cent growth in 2015 to around 495,000 tonnes.
European Union countries account for more than 99 per cent of Europe’s turkey meat. An anomaly in the FAO data is that there are no figures for turkey meat production in the Russian Federation, when at least two other sources put output currently around 100,000 tonnes a year!
Within the EU, France and Germany vie for the position of the leading turkey producer depending on which series of data is looked at.
However, they both tell the same story regarding production trends.
These are diverse with output in France contracting sharply since 2000, while Germany’s industry moved in the opposite direction until 2010, though latterly it has contracted somewhat.
While there have been some annual fluctuations, production in Italy has shown little change since 2000.
Despite differences in the absolute production levels according to the source, current output in the UK remains well below the 2000 level.
High red meat prices in Canada have enabled the turkey sector to expand to around 172,000 tonnes this year.
The more than four per cent per year expansion in turkey production in Africa has primarily been due to the development of the industries in Tunisia and Morocco, these two accounting for almost 78 per cent of the regional total of 109,000 tonnes in 2013.
The major players in the Americas and Europe have been commented on earlier in the individual country reviews.
Production in Asia declined sharply during the review period reflecting a cutback which occurred in Israel.
Similarly, developments in one country, Australia, have a major impact on the situation in Oceania, as this country accounts for 94 per cent of the regional figure. Production in Australia appears to have been stable in recent years though, as in many countries, it has failed to improve on the 2000 level.
June 2015