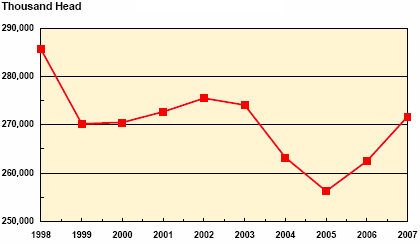
Turkeys Raised in 2007 Up 4 Percent from 2006
US - Turkeys raised in the United States during 2007 totaled 272 million birds, up 4 percent from the 262 million raised in 2006. 7 January 2008
 3 minute read
Minnesota ranked first in the number raised with 48.0 million, followed by North Carolina with 39.0 million, Arkansas with 31.0 million, Virginia with 22.0 million, Missouri with 20.0 million, California with 16.0 million, and Indiana with 15.3 million. These States accounted for 70 percent of the turkeys produced in the United States during 2007.
Turkey Growers Plan a 2 Percent Increase in 2008
Turkey growers in 23 States intend to increase the number of birds raised by 2 percent in 2008. These States produced over 99 percent of the turkeys raised in 2007. Intentions for the top seven producing States, compared with 2007, are as follows: Minnesota up 2 percent, North Carolina unchanged, Arkansas up 3 percent, Virginia up 2 percent, Missouri up 5 percent, California up 4 percent, and Indiana up 6 percent.
The number of turkeys actually raised in 2008 may vary from growers' intentions shown in this report depending on feed costs, supply of hatching eggs, cost of poults, and prices growers receive for turkeys during the next few months.
Agricultural Statistics Board
NASS, USDA
Reliability of Turkeys Raised Estimates
Survey Procedures: Survey data for the turkeys raised estimates are collected from a list of contractors and independent growers during December. States use all known sources of producer names to ensure that the list is as complete as possible. Turkey producers are then contacted either by mail, telephone, or in person. Diligent effort is made to ensure that all operations are accounted for in the estimate.
Estimation Procedures: Turkeys raised estimates include young turkeys intended for meat production, as well as breeder turkeys which reached maturity during the calendar year. These estimates exclude turkeys lost to disease or those destroyed. Placements of turkey poults from the Monthly Turkey Hatchery Survey provide the basis for the preliminary estimates published in August. Final estimates, published in January, use indications from the Turkey Inquiry Survey in addition to updated hatchery data. Other indications for the final estimates are obtained from monthly slaughter totals and check-off data provided by individual State turkey or poultry associations.
Revision Policy: Estimates for the previous year are subject to revision when preliminary raised estimates are made in August and during the January annual time period. Revisions are primarily based on updated hatchery data, updated slaughter data, and import and export data received from the U.S. Census Bureau. Estimates are also reviewed after data from the Census of Agriculture are available, and no revisions are made after that date.
Reliability: Turkeys raised estimates are based on a census of known active producers, and therefore, have no sampling variability. However, estimates may be subject to errors such as omissions, duplication, and mistakes in reporting, recording, and processing of the data. These errors are minimized through strict quality controls in the edit and summarization process, and a careful review of all reported data for consistency and reasonableness.
To assist in evaluating the reliability of the estimates in this report, the “Root Mean Square Error” is shown for selected items in the following table. The “Root Mean Square Error” is a statistical measure based on past performance and is computed using the differences between first and final estimates. The “Root Mean Square Error” for the difference between intention estimates and the final raised estimates, in 23 select States over the past 10 years, is 1.7 percent. This means that chances are 2 out of 3 that the final estimate will not be above or below the current intentions estimate of 277 million turkeys by more than 1.7 percent. Chances are 9 out of 10 that the difference will not exceed 3.0 percent.