

CME: Russian Heat-Wave May Spark Wheat Crisis
GLOBAL - Russia's announcement yesterday (5 August) that it would suspend wheat exports may have been the spark needed to set off the tinderbox that has been the wheat market of the past three weeks, write Steve Meyer and Len Steiner in their Daily Livestock Report (DLR) for 6 August.Nearby September CME Group wheat futures closed today at $7.85-3/4/bushel, up the allowable 60-cent per bushel limit. That price compares to the last 'local' low of $4.26 the week of 7 June – a run-up of 87 per cent in just two months. Nearby Kansas City wheat futures closed $0.53-1/2 higher at $7.80/bushel.
The fuel for today's explosion, of course, is the actual tinderbox that is Russia's – and Ukraine's and Kazakhstan's – wheat-growing regions. We direct your attention first to page 2 where you will find today's temperature forecast maps from wxmaps.org. As you can see, the temperature outlook for the next two weeks for the areas just north and east of the Black Sea is bad to say the least. (We included the pointer because the map was difficult to read, not because we thought readers would have trouble locating the Black Sea.)
The top two maps show mean surface temperature forecasts for the next two weeks. The orange and red areas indicate average surface temperatures of 25 to 30 and 30 to 35 degrees Celsius (77 to 86 and 86 to 95 degrees Fahrenheit). Two features are noteworthy. First, wxmaps.org does not provide a definition of mean surface temperature but we believe, based on other weather sites providing average as well as maximum and minimum temperatures, that this map shows daily average temps – and some are in the upper 80s and low 90s Fahrenheit. Very hot indeed. Further, we must remember that this geographic area is at roughly the same latitude as southern Canada. While high temperatures are not unheard of at these latitudes, extended periods of heat are very rare and this one has been going on for over a month in Russia/Ukraine.
Why is this so important? Because Russia and the other two countries have become very important in world wheat production and trade AND because wheat is a feed grain in many parts of the world, thus driving to some degree, corn prices in the US.
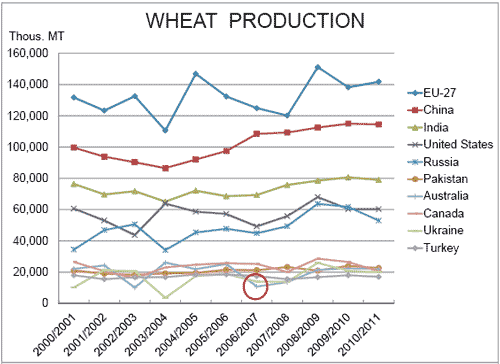
The first chart below shows annual wheat production by the 10 largest wheat producing countries in 2010. Russia ranked fourth last year, roughly even with the US. Ukraine ranked ninth in total production. Note that the 2011 observation for Russia is USDA's July prediction of 53 million metric tons (MMT). Informa has reportedly dropped their estimate of 2011 Russian output to 49MMT, 2MMT lower than one month ago. Many expect USDA's estimate to fall when the next WASDE is released on 12 August. But how far?

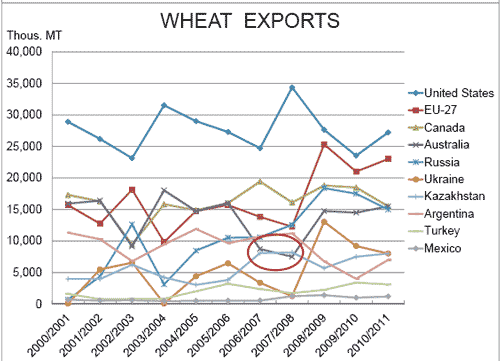
Russia also ranked fourth in wheat exports last year, trailing only the US, EU-27 and Canada. Note that Ukraine and Kazakhstan ranked 6th and 7th, respectively, in 2009-2010 wheat exports so this entire region is even more important for world wheat trade than it is for world wheat production.

Finally, we have put red circles on both charts to draw attention to what happened to Australia's production in 2006-07 and exports that year and the next. While far from the only reason for the commodity price explosion of 2007-2008 ($140 oil did play a bit of role in that!), the short 2007 Australian crop was a key igniter of the rally. Further, Australia is the ONLY southern hemisphere country on the production chart and one of only two such countries on the export chart. If this summer's northern hemisphere wheat crop is indeed short, there won't be much help until next summer.


