Applied Broiler Research Farm Report: Propane Usage Before and After Renovation
By G.Tom Tabler, Manager, Applied Broiler Research Unit -Savoy Department of Poultry Science, University of Arkansas and published in Avian Advice. 23 April 2007
 5 minute read
Introduction
The Applied Broiler Research Farm (ABRF) is a 4-house commercial-scale broiler farm constructed by the University of Arkansas in 1990 with the unique capability to closely monitor gas usage. In January 2006, a complete and total renovation of the farm began. This article on gas (propane) usage is the first of a planned series of “before and after” reports on ABRF performance in various areas.Farm Background
Before renovations, the farm consisted of four 16-year-old 40 x 400' broiler houses that had received only minimal improvements over the years. The houses were completely stripped down to where only the trusses, roofs, and end walls remained. The drop ceilings also remained intact in the two wood truss houses. Drop ceilings were installed in the two steel truss houses and enough loose fill insulation blown into the attic to match the R-19 in the two houses that already had drop ceilings. Curtain sides were replaced with solid sidewall construction on all houses. New feeders, new drinkers, new cool cell systems, crossover foggers and tunnel ventilation fans for summer cooling were installed as well as new north sidewall fans and vent door air inlet systems for minimum ventilation. The farm was completed re-wired and new automatic controllers, backup thermostats, and light dimmers were installed in each house. A gas chlorination system was installed along with an additional pump system that injects Poultry Water Treatment (PWT; Jones-Hamilton Co.) to treat the farm's well water supply.
The farm resumed growing broilers in April 2006. Two flocks of small birds (38 days old) and two flocks of larger birds (49 and 50 days old) were grown. One flock each was placed in April, June, August, and October of 2006. Propane usage data and temperature data from the National Weather Service are reported below.
Gas Bill as a Percentage of the Chicken Check
Throughout 2001, 2002 and until August of 2003 gas prices remained constant at 0.88 cents per gal (Table 1).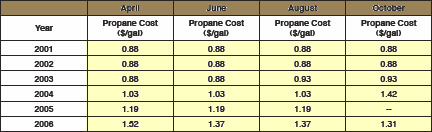
August and October flock prices climbed to 0.93 cents per gal. Prices continued to climb during 2004 with the price of gas for the April, June, and August flocks at $1.03 per gal and increasing to $1.42 for the October flock. By April 2005, prices had dropped back to $1.19 per gal and remained steady through the August 2005 flock. There was no October flock 2005 because the farm was shut down in preparation for renovations. By April 2006, when renovations were complete and the farm came back on line, gas prices were $1.52. Prices dropped to $1.37 for the June and August flocks and dropped yet again for the October flock to $1.31.
The price of propane and the number of days when supplemental heat was required both had an effect on the percentage of the settlement check devoted to paying the gas bill (Table 2).
2 Days with lows below 65 degrees F (from National Weather Service)
The National Weather Service data shown suggest that outside temperatures in April and June of 2006 were warmer than most of the previous five years. October temperatures appeared to be slightly colder than previous years and little supplemental heat was require in August. The June and August flocks of 2006 (after renovations) accounted for the least percentage spent on fuel of any year during the 6-yr period. This is due, in part, to tighter houses, solid side walls, better insulation, and better control of the ventilation system. The 0.09 ¢/lb increase in pay per pound of salable meat is also partly responsible because the 2006 chicken checks were larger than any of the previous years' checks.
Gallons of Gas Required
Propane usage data before and after renovation by placement month are shown in Figure 1. The number of days when heat was required (Figure 2) and the number of days when outside temperatures were at or below freezing (.32oF) (Figure 3) are also shown. In all three figures the data listed as before represent an average of the previous 5 years (i.e. 2001-2005), while data listed as "after" are 2006 data.
Placement Month
Placement Month
A big unknown after the renovation was how would gas consumption change compared to before the renovation. Since at the creation of this article we have not been through the cold, winter season, peak demand usage is still unknown but that information will eventually be available for dissemination.
Fewer gallons of propane were used in April, June and August placed flocks in 2006 than in the average previous 5 years (Figure 1). There were fewer days in April, 2006 requiring heat (Figure 2) and fewer days with freezing temperatures (Figure 3) than in the '01-'05 average, which could account for lower propane usage figures. However, temperatures were in June and August were virtually identical when 2006 was compared with the average of the previous 5 years. Yet, as compared with the average of the previous five years, less propane was used in June and August of 2006. This apparent increase in energy efficiency is likely due to renovation. In October there were more days requiring heat (Figure 2) and more days with freezing temperatures (Figure 3) in 2006 than in the average of the previous five years. Yet the newly renovated houses only 8.5% (381 gal.) more propane than the average of the previous five years. These data again suggest that renovations made the houses more energy efficient.
Placement Month
Summary
Presented is gas usage data before and after renovations at the University of Arkansas' ABRF. Many poultry producers have recently gone through major renovations on their farms similar to those at the ABRF. This information, along with data currently being collected should be of interest to producers and provide a clear “before and after” assessment of gas usage and help determine the true value of farm renovation.
March 2007