Data Storytelling on the Poultry Farm: an effective way to take assertive decisions
Hiprastats 8 April 2021
 2 minute read
 By:
By: Livestock farmers and companies are becoming more and more adept at capturing data, but true value is generated from the information that can be obtained with the analysis of these data.
There are a lot of questions that are widely asked in poultry production such as: What is the most efficient feed formulation? Does it change depending on stocking density? What risk factors should I manage in my Hatchery to get better quality day-old chicks? What is the most efficient IBD vaccine for my company? Should I make any changes to my management or biosecurity protocols to reduce antibiotic consumption? However, hardly ever are data analysed to answer these questions.

Data Storytelling
Data analysts have an important role in adding certainty to decisions. We can tell if the differences that we observe in the data are by chance or not. We go from perception to knowledge: what would happen if we were to collect the data from new flocks/farms? Would we observe the same differences?
However, the main challenge in data analysis is to express the results. On their own, statistics are just numbers. The Homo Data Scientistus generally falls in love with causal, data-driven reasoning when presenting their work. This is generally the right way to argue. But to evoke actions, Data Scientists need to tell stories. As Brené Brown says, maybe stories are just data with a soul. But the best way to think of data storytelling is that it is a strategy to share knowledge (insights) in a way that allows the target audience to understand what has happened, why it has happened and what decision they should take.
Example: a poultry company has tons of data recorded at the hatchery and on various broiler farms. The company is worried about the increased mortality at farm level; however, they are unable to figure out what is happening and what are the risks factors associated with the increased mortality. Instead of letting data sit, they believed in data science to turn the problem into an interesting infographic that offered them useful insights. This helped them to understand how they could improve their performance, from adjusting the type of setters they use at the hatchery to which IBD vaccine is more profitable.
Key steps in data storytelling at the poultry farm:
1. Establish a clear goal (outcome)
The outcome is key to identifying what is the most valuable information you need to collect and analyse in order to achieve the goal. Think where you want to go, and then organise the information you need. BEGIN WITH THE END IN MIND.
2. Examine data with visualisation
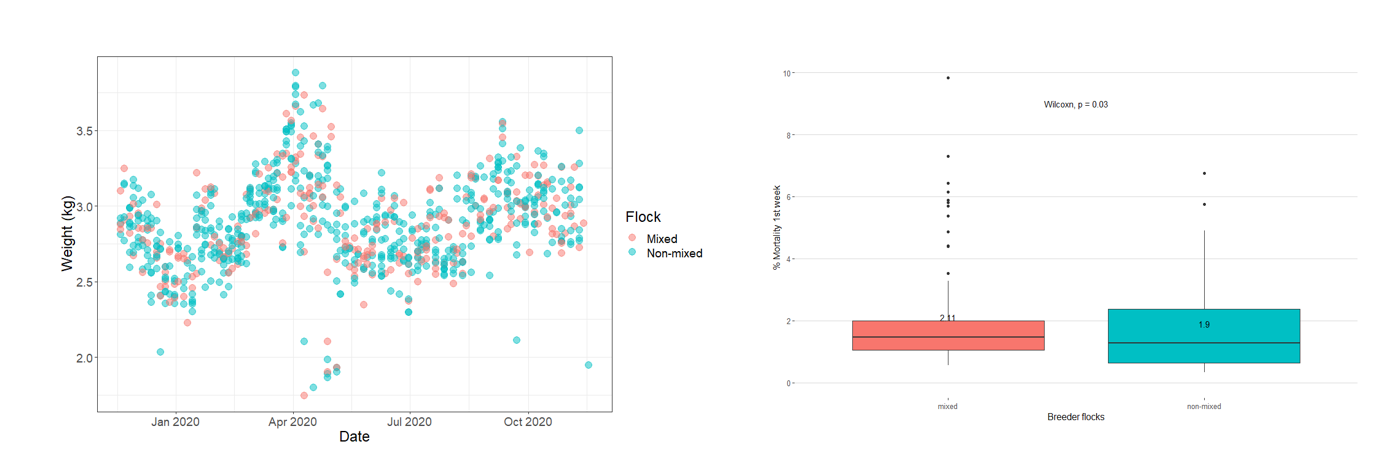
Through graphical visualisation of statistical information, it is possible to build and illustrate a compelling story. Data analysts can explore the data and identify the causes of certain observations. But it is essential to choose an effective visualisation to draw conclusions. In the end, to show patterns or relationships between parameters, data analysts need to be creative (see examples in graph 1).
Rising insight #1: Are my KPIs affected by mixed breeder origins?
Rising insight #2: What is the effect of increased storage days on hatchability and embryonic mortality?
3. Communicate insights with a narrative
The final step is to find something new to learn (insights), or a fresh perspective to make decisions. However, all insights need more than just numbers to be converted into conclusions:
- It is important to give explanations of how the conclusions were reached (i.e. there is an increase in early mortality at the farm driven by several factors because the results indicate that, setter and heat loss during transfer affect mortality).
- It is also important to give a rational justification of why the data are analysed in a certain way (i.e. to be able to compare conversion index between groups we need to observe the differences at the same slaughter weight; this is why it is important to adjust feed conversion index by slaughter weight).
- The next step is to convince that conclusive results can be converted into actions (i.e. try not to store the eggs for more than 10 days).
- Lastly, to express why the insights are valuable and how they fit into the overall goal (economic impact).
END WITH THE BEGINNING IN MIND.
HIPRASTATS is a data science service available to HIPRA customers who want to overcome the challenge of Animal Production 4.0: understanding the relationship of multiple factors to invest resources exactly where it makes a difference in animal health
For more information contact your local HIPRA representatives