De-Stratification Fan Study
Improvements in temperature distribution both horizontally at bird height and vertically across the profile of the building were noted when the de-stratification fans were operating, according to a report by Oli Coe of Farm Energy following research carried out for Hydor Ltd. 26 March 2011
 13 minute read
Summary
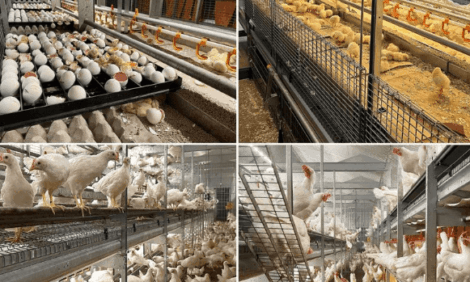
Hydor Ltd requested that Farm Energy investigates the effects of using de-stratification fans on energy consumption and temperature distribution within a poultry (broiler) building. The test was carried out at the poultry farm, following a recent installation of the de-stratification equipment.
The effect of five evenly spaced de-stratification fans in a 50,000-bird building was monitored. The building was ventilated by 22 ridge fans and heated by eight direct-fired LPG heaters each of 65.9 kW rating. The de-stratification fans were switched off and on, on alternate days; measurements of temperature were recorded, and energy use was derived. Farm Energy engineers analysed data from 14 temperature loggers placed in a horizontal and vertical array, and compared this with the building’s recording system.
Improvements in temperature distribution both horizontally at bird height, and vertically across the profile of the building were noted when the fans were operating. Heater hours and therefore gas consumption were reduced when fans were operating. The following table summarises the results:
| Table 1. Summary table of the effects of running Hydor de-stratification fans | ||
| Fans operating | No fans operating | |
|---|---|---|
| Average vertical temperature difference (whole period/week one) | 1.31°C / 1.87°C | 2.72°C / 3.25°C |
| Average horizontal temperature difference (whole period/week one) | 0.57°C / 0.62°C | 1.02°C / 0.98°C |
| Gas use | 93,281 kWh | 111,402 kWh |
| Total gas saving | 15.75% | 0% |
| Cost of gas (45p/litre) | £5673 | £6774 |
| Value of gas saving | £1102 | £0 |
| Fan running costs | £43 | £0 |
| Overall savings | £1059 | £0 |
| Capital cost of fans per shed (excluding installation) | £2420 | |
Introduction
Hydor Ltd requested that Farm Energy investigates the effects of using de-stratification fans on energy consumption and temperature distribution within a poultry (broiler) building. The test was carried out at a poultry farm situated in the midlands, following a recent installation of the de-stratification equipment.
The following measurements were taken:
- Electricity consumption of the Hydor fans, extraction fans and the heater fans.
- Temperatures within the shed at 14 points forming a horizontal and vertical array.
- Ambient temperature.
- Heater hours were derived.
Verification of all of the data was carried out using the buildings’ Agrologic control computer.
The effects of de-stratification fan operation on the following were investigated:
- Temperature distribution in the vertical profile
- Temperature distribution in the horizontal profile
- Gas use
- Electricity use
- Overall energy consumption.
Additionally, trials were carried out before the birds were put into the building in order to establish the best operating speed of the fans.
Measurements
Temperature Logging
Fourteen temperature loggers were installed in two groups of seven, ten metres apart in Zone 1. See Figure 2.
Heating and ventilation in the shed is controlled by an Agrologic control system, which also records data about the internal and external conditions.
Temperature readings were taken every 45 seconds for a period of just under a month. The Hydor fans were switched alternately on or off each day at 08:00 hrs in order to collect temperature data for de-stratified and non de-stratified conditions.
The investigation started on day 1 (01/12/2010) and concluded on day 31 (31/12/2010). The birds were put in at one day of age on 4 December (day 4), and continued to grow after the trial was concluded.
| Table 2. Zone details | |||
| Zone | Heaters | Hydor Fans | Extraction Fans |
|---|---|---|---|
| Zone 1 | 3 x 65.9kW | 5 Fans Evenly Distributed | 22 Fans Evenly Distributed |
| Zone 2 | 2 x 65.9kW | ||
| Zone 3 | 3 x 65.9kW | ||
Establishing the Best Fan Speed
Before the trial began in earnest, the most suitable speed for the de-stratification fans to operate needed to be determined. The determining criteria were:
- Best vertical temperature distribution to give energy savings i.e. smallest temperature difference between the top of the shed and at bird level, but
- Highest acceptable air turbulence at bird level without causing behavioural problems with the birds.
Ranges of fan speeds were tested, from 30Hz to 45Hz.
Results
Establishing best fan speed
A fan speed of 40Hz (80 per cent) gave the best compromise between floor disturbance and temperature distribution.
Vertical temperature distribution
The following graphs show the effect on temperature at three different heights within the shed for the days when the fans were off and those when the fans were on. The data used was representative of typical days during the study.
The graphs show a reduction in temperature difference between the top and the bottom of the building when the fans were operating.
The temperature differences on average were:
- Fans on: 5.5°C
- Fans off: 7°C.
Horizontal temperature distribution
In addition, although not initially outlined in the objectives of the study, the effect of the Hydor fans upon the horizontal distribution was analysed. The temperatures for the left hand side, centre and right hand side of the building at bird level are shown in the graphs that follow.
As with the vertical temperature distribution, the horizontal temperature difference is smaller when the fans are operating1.
1 Details of the effect of temperature upon growth rate of poultry have been included in the appendices for reference purposes.
The following graph shows the temperature differential (differences between the maximum and the minimum temperature in the shed) for the period. The ‘red lines’ represent periods when the destratification fans were off, and the ‘blue lines’ when the fans were on.
The graph shows that:
- During the early part of the trial the temperature differences are reduced when the fans are on
- The temperature differences towards the end of the trial (approx. 21 December) converge. This is probably due to the shed ventilation rate increasing to such a level that the de-stratification air volume is insignificant. A typical minimum venting profile for the bird age (green line) has been shown alongside the temperature data to show the coincidence of these two events.
Better temperature mixing and a reduced temperature differential between the floor and ridge of the building helped the bird-level temperature to respond quicker to heater operation. Therefore, the cycling of heater operation was more rapid with the fans on. However, the quick temperature lift helped to shorten the overall operational time of the heaters, therefore saving energy.
At any given bird-level temperature, average building temperature was always lower with destratification fans on, so heat losses of the building through the structure and through air leakage were less.
Recommendation: Because the benefits of the improved temperature distribution are negated by the extraction regime after about day 20, the fans could be switched off from this point. Extended use might be considered in summer months where higher air speeds at bird level could help to provide additional cooling.
Gas use
Heater operational times were measured and compared with the times reported by the climate computer. Good correlation was obtained between the two monitoring systems (Figure 8).
Gas consumption in the shed was derived by multiplying the operation time of the heaters by the heater ratings. Running times reported by the logging system and the building control computer were used to obtain an average heater running time.
A ‘degree day’ figure (a measure of how hard the heating needs to work to maintain shed temperature relative to the outside temperature) was derived from the difference between measured internal and external temperatures.
This was used to normalise the hours of heating energy. Actual and normalised heating hours together with energy savings have been calculated for the duration of the trial and are shown below. Note that, for the purposes of this analysis, the numbers have been adjusted to simulate continuous operations/no operation of the de-stratification fans rather than every-other-day use.
Generally, heating operation is less with de-stratification fans in use. Anomalies around 9, 16 and 23 December are mainly due to data loss during data collection. On 24 - 25, ventilation shutters were reported as being frozen stuck which may explain discrepancies.
Electricity use
Electricity use for the Hydor fans averaged 14.84 kWh per day.
Energy Use
| Table 2: Hydor technical specification | |
| Hydor fan technical specification | |
|---|---|
| Air flow | 3.11 m/sec |
| Power | 390 W |
| Start amps | 7.6 A |
| Sound | 60 dBA |
| Speed | 900 rpm max |
| FL amps | 2.9 A |
| Capacitor | 12 |
The cost of the Hydor fans is £2,420 per shed excluding installation costs.
Based on the total hours calculated allowing for varying temperature data, for days when the Hydor fans were running and when they were not, we were able to calculate the gas savings made from running the fans. This is offset by the typical cost of running the fans daily. Cost savings have been calculated on this basis.
For the purposes of the calculations: gas price = 45p per litre (LPG), electricity price = 10p per kWh.
| Table 3. Day-by- day results of heater hours and savings made | ||||||
| Date | Adjusted heater hours | Hours saving | Gas saving kWh |
Gas saving litres |
Hydor fans kWh use (average) |
|
|---|---|---|---|---|---|---|
| FANS ON | FANS OFF | |||||
| 03/12/2010 | 9.5 | 12.5 | 3.1 | 1,618 | 219 | 14.84 |
| 04/12/2010 | 8.4 | 11.7 | 3.3 | 1,739 | 235 | 14.84 |
| 05/12/2010 | 8.4 | 11.6 | 3.3 | 1,719 | 232 | 14.84 |
| 06/12/2010 | 7.4 | 10.7 | 3.3 | 1,737 | 235 | 14.84 |
| 07/12/2010 | 7.5 | 11.1 | 3.6 | 1,877 | 254 | 14.84 |
| 08/12/2010 | 7.6 | 8.7 | 1.1 | 597 | 81 | 14.84 |
| 09/12/2010 | 8.3 | 8.4 | 0.1 | 68 | 9 | 14.84 |
| 10/12/2010 | 8.0 | 7.6 | -0.4 | -222 | -30 | 14.84 |
| 11/12/2010 | 8.4 | 8.0 | -0.4 | -216 | -29 | 14.84 |
| 12/12/2010 | 7.2 | 8.5 | 1.3 | 688 | 93 | 14.84 |
| 13/12/2010 | 6.5 | 9.0 | 2.5 | 1,309 | 177 | 14.84 |
| 14/12/2010 | 6.4 | 8.6 | 2.2 | 1,143 | 154 | 14.84 |
| 15/12/2010 | 6.4 | 7.3 | 0.8 | 444 | 60 | 14.84 |
| 16/12/2010 | 6.0 | 5.5 | -0.6 | -306 | -41 | 14.84 |
| 17/12/2010 | 7.2 | 7.6 | 0.4 | 189 | 26 | 14.84 |
| 18/12/2010 | 6.5 | 8.6 | 2.1 | 1,113 | 150 | 14.84 |
| 19/12/2010 | 7.3 | 9.5 | 2.1 | 1,130 | 153 | 14.84 |
| 20/12/2010 | 6.9 | 8.7 | 1.8 | 947 | 128 | 14.84 |
| 21/12/2010 | 5.8 | 7.5 | 1.8 | 932 | 126 | 14.84 |
| 22/12/2010 | 4.5 | 6.1 | 1.6 | 850 | 115 | 14.84 |
| 23/12/2010 | 4.1 | 5.5 | 1.4 | 736 | 100 | 14.84 |
| 24/12/2010 | 4.6 | 4.8 | 0.1 | 75 | 10 | 14.84 |
| 25/12/2010 | 6.2 | 5.2 | -1.0 | -515 | -70 | 14.84 |
| 26/12/2010 | 4.8 | 4.6 | -0.3 | -150 | -20 | 14.84 |
| 27/12/2010 | 3.2 | 3.9 | 0.7 | 356 | 48 | 14.84 |
| 28/12/2010 | 2.0 | 3.3 | 1.3 | 674 | 91 | 14.84 |
| 29/12/2010 | 1.2 | 2.7 | 1.5 | 808 | 109 | 14.84 |
| 30/12/2010 | 2.6 | 2.2 | -0.4 | -208 | -28 | 14.84 |
| 31/12/2010 | 4.2 | 2.2 | -1.9 | -1,010 | -137 | 14.84 |
| TOTALS | 167.5 | 198.8 | 31.3 | 18,121 | 2,449 | 430.4 |
| COST | 15.75% | £1,101.94 | £43.04 | |||
| Average daily values | 5.8 | 6.9 | 625 | £37.99 | £1.48 | |
Over the period of the trial, a projected gas saving of about £1,100 would have been made if the fans had been on for the entire duration, rather than every other day. Predictably, actual savings were about half of this figure. It is difficult to draw out a yearly projection, due to the fact that the test was carried out in the winter weather, so generally gas use will be more. As well as this, the trial did not continue toward the end of the bird cycle, when set temperatures are reduced. Nevertheless, in terms of pure percentages, there is no technical reason why a 15 per cent heating fuel saving could not be sustained through the whole year.
It is clear to see that a large saving can be made from running the de-stratification fans until the ventilation regime becomes detrimental to their effect.
For a more comprehensive idea of cost savings for a whole year, it is recommended that a similar study should be undertaken in the summer months. Further investigations could also be carried out over an entire crop cycle of the birds for continuity. From the data obtained within this trial and a summer trial, a yearly profile can be drawn up and total cost savings can be made with more accuracy.
Conclusions
The benefits of the Hydor de-stratification fans were found to be:
- That temperatures were seen to be more evenly distributed in the vertical and horizontal planes when the de-stratification fans were running. It is thought that this improvement in temperature distribution across the shed could result in better growth rate and feed conversion assuming that birds respond to a more accurately controlled thermal environment.
- That when the ventilation of the shed increased to around 40 m3/h per 100 birds the benefits of the de-stratification fans became negligible in terms of energy saving.
- The projected heater running time for the trial with de-stratification fans operating was 168 hours compared to 200 hours with no de-stratification (15.5 per cent reduction with de-stratification). This resulted in a saving of approximately 2,500 litres of LPG, or £1,100 in heater running costs.
- The cost of running the de-stratification fans was about £1.50 a day or £46.50 for the trial period.
References
Controlled Environments for Livestock (1990), Farm Electric
Assessing Thermal Comfort of Broiler Chicks (2008), J.L. Purswell, B.D. Lott, W.A. Dozier III, W.B. Roush and S.L. Branton
Appendix
Effects of temperature on growth rate of poultry
It is critical to note the importance of temperature distribution within the poultry shed and its effect upon livestock well-being. For any particular breed of livestock, there is a temperature at which an animal will start to divert more energy from growth to maintaining its own body temperature, for example, to keep warm. This level is called the lower critical temperature (LCT) and is a level at which the animal will start to shiver, increase metabolic rate, huddle with other animals etc. At the other extreme is the upper critical temperature (UCT), where the animal will use extra energy to keep cool, through sweating, blood vessel dilation etc. Between the LCT and the UCT is a thermo-neutral zone where body maintenance factors are at a minimum and hence maximum use of an animal’s food is obtained for growth.
In terms of lower and upper critical temperatures for poultry, the limits vary with age and are less well defined than for those of pigs etc. The factors that can contribute towards the critical temperature of birds can include the strain of the bird, stocking density conditions and feed requirements. Day old chicks for example require an environmental temperature of about 32°C, this temperature requirement reduces with age until a final temperature of about 19°C is reached at 36 days in the case of the poultry shed studied here.
Therefore, the effects of temperature distribution within a poultry shed can have a large effect upon crop yield. In the case of this shed, the thermostatic temperature monitor that controls the heater to come on and go off is located about a third of the way across to the left. This is a position where temperatures are typically lower than in the central portion of the shed, but higher than the readings taken at the very left, (or right) of the shed when the fans are off. Thus, the heater is coming on when the centre is already above the set point, and the sides of the shed are below the actual set point. With reference to Figure 11, this could mean that birds to the left and the right of the shed may not be growing at the optimum rate, and may be eating more food than is considered ideal. Equally, birds in the very centre may be eating less food than is considered the best rate for food conversion and growing at a lesser rate. With a more even distribution of temperature as is facilitated by the fans, the feed intake, growth rate and food conversion rates can be maintained at an optimum throughout the entire shed.
March 2011