

Economic position of the UK farming industry
By Defra - This report provides regularly updated economic and statistical analysis of the profitability of the poultry farming industry. It builds on, and in some cases updates, the analysis published in the Strategy for Sustainable Farming and Food.
Aggregate Incomes Across the Whole Farming Industry
In 2003, total income from farming in the UK was estimated to be £3.23 billion, a rise of 34 per cent (or 30 per cent in real terms) over 2002. Because of a reduction in the number of farmers, total income from farming per full time person equivalent was estimated to rise in 2003 by 39 per cent or by 35 per cent in real terms to £15,786.
The long term trend in aggregate income has been downwards although it rose and fell dramatically in the nineties due to changes in the exchange rates, world commodity prices and the impact of BSE. In 2003 we have seen a recovery in the Euro resulting in a rise in prices across a range of commodities and higher direct subsidy payments. In real terms Total Income from Farming is now at a level more in line with levels of the late eighties; it is 77 per cent above the low point in 2000 and 50 per cent below the peak in 1995.
The cereal sector contributed significantly to the increase in Total Income from Farming in 2003. A weather related poor harvest in continental Europe resulted in strong prices, particularly for feed grains, and increased demand for UK wheat. Strong prices and export opportunities were also seen for oilseeds. The horticulture sector saw a smaller increase in the value of production, again driven by higher prices, but for potatoes, decreases in yields and planted area are expected to offset higher prices. Prices have also increased across the range of livestock and livestock products.
Beyond 2003, there is likely to be only a modest recovery in commodity markets over the medium term future. However, when this is combined with the impacts of ending of the Over Thirty Months Scheme; the implementation of the remaining elements of the Agenda 2000 reform; the implementation of the latest round of CAP reform; and regulatory measures, there is expected to be little further change in aggregate incomes over the next five years (at current exchange rates) although there are likely to be fluctuations from the smooth trend shown (for example as CAP reform is implemented).
Most macro economic forecasters are expecting the current level of the euro to be sustained and this level (70p/€) is built into the baseline projection in the chart above. Projections are also provided to illustrate the effects of further movements in the exchange rate over and above the weakening of sterling relative to the Euro seen so far this year. The scenarios shown illustrate the effect of a further 5% weakening of sterling and the impact of a 12% strengthening which would bring the Euro back to 62p (the average level seen during the 2000-2002 period).
The other key driver of farm incomes is productivity. Following recently completed research,
(see
http://statistics.defra.gov.uk/esg/reports/prodagri/default.asp) the high productivity scenario within this analysis has been chosen to broadly match the growth rate seen for the leading group of EU Member States (France, Denmark, Holland and Belgium). The further recovery in incomes projected for 2003 will have lessened the economic pressure on productivity growth, and so this will remain a challenging path for UK agriculture to follow, but if achieved would give a further rise in incomes per head of nearly one quarter over the period.
Profitability in Key Sectors
Profitability in the key sectors is measured by the net margin; this provides the return to managerial labour and the return on capital.
Poultry
Laying Hens

Net margins for laying hens are based on data from a commissioned survey into the economics of egg production undertaken in 1992. The lapse in time and changes in the industry that have occurred since that time mean that the margins shown here can only be broad estimates but the trends in margin are robust.
In 2002 there was a rise in average profitability over the previous year. This reflects reasonably buoyant egg prices coupled with year on year reductions in feed costs in the second half of 2002 due to lower feed cereal prices.
Egg prices since July have been at over 40p/dozen.
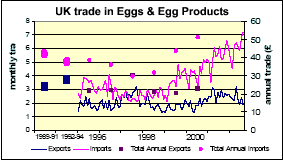
The value of egg imports has been growing at a slightly faster rate than that of exports since mid 1999.
Table Chickens (Broilers)
Net margins for broilers are estimates based on data from a variety of sources - the margins shown here should only be regarded as broad estimates but the trends in margin are robust.
Profitability in the broiler sector increased in 2002/03. This reflects year on year reductions in feed costs from mid 2002 onwards due to the lower cereal and soya prices. Poultry prices are currently 50p per kg.
As with the pig sector, future poultry margins will be affected by the increase in cereal prices from the 2003 harvest.
Total UK broiler production in 2002 was slightly lower than in 2001. Slaughterings in 2002 were higher over the same period (Jan-Aug) compared to that in 2003.
The value of UK poultrymeat imports consistently exceeds that of exports and the gap has widened in recent years.


To read the full report, including tables, please click here
Source: Defra - December 2003


