Economic position of the UK farming industry (poultry focus)
By Defra - This report provides regularly updated economic and statistical analysis of the profitability of the poultry farming industry. It builds on, and in some cases updates, the analysis published in the Strategy for Sustainable Farming and Food. 15 March 2004
 7 minute read

Aggregate Incomes Across the Whole Farming Industry
Total Income from Farming in the UK is estimated to have risen in 2003 by 32 per cent, or by 28 per cent in real terms, to £3.20 billion. Total Income from Farming per full time person equivalent is estimated to have risen by 36 per cent, or by 32 per cent in real terms to £15,537, as the long-term downward trend in the number of farmers continued in 2003.
The long term trend in aggregate income has been downwards although it rose and fell dramatically in the nineties due to changes in the exchange rates, world commodity prices and the impact of BSE. During 2003 there was a recovery in the Euro resulting in a rise in prices across a range of commodities and higher direct subsidy payments. In real terms Total Income from Farming in 2003 was at a level more in line with levels of the late eighties; it was 77 per cent (in real terms) above the low point in 2000 and 50 per cent below the peak in 1995.
The value of output for cereals increased by 9.7 per cent. Drought and very hot weather conditions in central and southern Europe during the summer of 2003 adversely affected cereal crops in other European countries. This led to high demand in Europe and strong prices. The value of output of wheat increased by 6.2 per cent and barley by 17 per cent.
The livestock sector saw an increase of 4.3 per cent in the value of output, largely as a result of an increase of 12 per cent in the value of sheep, assisted by an increase of 7.9 per cent in the total value of sheep subsidies paid. The value of output of livestock products increased by 8.5 per cent as a result of the milk sector increasing by 6.7 per cent following the agreements by supermarkets to raise prices for liquid milk. There was also a 16 per cent rise in the value of
output of eggs as prices rose to their highest level since 1996.
Turning to 2004, a small step down from 2003 is expected as cereal prices return to more normal levels. Beyond this, there is likely to be only a modest recovery in commodity markets over the medium term future. Various other factors will shape the trend in future levels of income, some positively and some negatively. Particularly important are: the future of the Over Thirty Months
Scheme; the implementation of the remaining milk reform of Agenda 2000; the implementation of the latest round of CAP reform; and regulatory measures. Taking these th impacts together there is expected to be little further change in aggregate incomes over the next five years (at current exchange rates) although there are likely to be fluctuations from the smooth trend shown (for example as CAP reform is implemented).
The level of the £/euro exchange rate will, as in the past, be a key factor. Most macro economic forecasters are expecting the current level of the euro to be sustained and this level (70p/€) is built into the baseline projection in the chart above. Projections are also provided to illustrate the effects of further movements in the exchange rate over and above the reduction of sterling
relative to the Euro seen during 2003. The scenarios shown illustrate the effect of a further 5% weakening of sterling and the impact of a 12% strengthening which would bring the Euro back to 62p (the average level seen during the 2000-2002 period).
The other key driver of farm incomes is productivity. Following recently completed research (see
http://statistics.defra.gov.uk/esg/reports/prodagri/default.asp) the high
productivity scenario within this analysis has been chosen to broadly match the growth rate seen for the leading group of EU Member States (France, Denmark, Holland and Belgium). The further recovery in incomes seen in 2003 will have lessened the financial pressure on productivity growth, and so this will remain a challenging path for UK agriculture to follow, but if achieved would give a further rise in incomes per head of around a fifth relative to the baseline position.
An analysis comparing UK and EU farm incomes and farmgate prices has been published on the Defra website – see http://statistics.defra.gov.uk/esg/reports/ukeuincfarm.pdf (PDF Format)
Profitability for different types of farm in 2003/4
Estimates of net farm income and cash income for full time farm business in the UK are provided by the annual Farm Business Surveys conducted in England, Wales and Northern Ireland and the Farm Accounts Survey in Scotland. For consistency, only farms that were not subject to compulsory culling during the FMD outbreak are included.
Average net farm income for full-time farms is expected to increase by 68 per cent overall between 2002/03 and 2003/04, and cash income by 31 per cent. This is higher than the increase in Total Income from Farming. The net farm income forecasts relate to the 12 months ending February 2004 and include recent and continuing high cereals prices. Total Income from Farming relates to the calendar year 2003 and excludes some of the effect of these high prices. This is the main reason for the difference. Minor increases in output have an exaggerated effect on income which is the relatively small difference between output and input costs.
Incomes on pig and egg laying farms are forecast to increase reflecting higher egg and pigmeat prices. However higher feed prices, particularly cereals are now affecting profitability in these sectors. Higher cereal prices are also squeezing margins for poultrymeat producers.
Farm Diversification is increasingly important
A report on farm diversification has been published on the Defra website http://statistics.defra.gov.uk/esg/reports/divagri.pdf Key results from the Farm Business Survey are:
Around 70% of farming households on farms of 8 ESU or more supplement their income from agriculture, either by diversifying into other activities or through outside self-employment or employment.
Over half of farms have diversified activities and a quarter of farmers or their spouses work off the farm.
Average earnings in 2002-3 from diversification were £1,800 per farm, up 30 per cent on the previous year.
The most common form of diversification is renting of buildings for non-farming use. Although the Farm Business Survey does not record how much of the contract work is for non-agricultural activities, it is likely that this too is fairly widespread.
Although rural crafts and sport and recreation have the lowest participation rates, they are generally operated on a bigger scale than other forms of diversification, in terms of value of output per farm.
Although 56% of ‘full-time’ farmers have diversified businesses, many of these activities are very small-scale; for a quarter of farmers with diversified activities, the output from these diversified activities is less than £500.
For 15% of farmers with diversified activities however, output from these businesses was over £20,000, capable of yielding an important supplementary income.
3,600 farms had turnover of £20,000 - £50,000
Poultry - Laying Hens
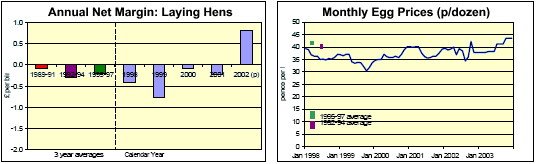
Source: Net margins based on the series of ‘Special Studies in Agricultural Economics’
Net margins for laying hens are based on data from a commissioned survey into the economics of egg production undertaken in 1992. The lapse in time and changes in the industry that have occurred since that time mean that the margins shown here can only be broad estimates but the trends in margin are robust.
In 2002 there was a rise in average profitability over the previous year. This reflects reasonably buoyant egg prices coupled with year on year reductions in feed costs in the second half of 2002 due to lower feed cereal prices.
By the end of December 2003 average egg prices had risen to approximately 44p/dozen.
The value of egg imports has been growing at a slightly faster rate than that of exports since mid 1999.
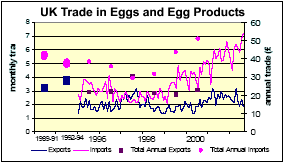
Table Chickens (Broilers)
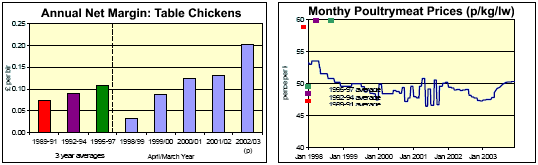
Net margins for broilers are estimates based on data from a variety of sources - the margins shown here should only be regarded as broad estimates but the trends in margin are robust.
Profitability in the broiler sector increased in 2002/03. This reflects year on year reductions in feed costs from mid 2002 onwards due to the lower cereal and soya prices. Poultry prices are currently 50p per kg.
As with the pig sector, future poultry margins will be affected by the increase in cereal prices from the 2003 harvest.
Total UK broiler production in 2003 was 4 per cent higher than in 2002 at 1,245 thousand tonnes.
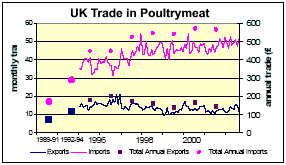
The value of UK poultrymeat imports consistently exceeds that of exports and the gap has widened in recent years.
To read the full report, including tables, please click here (PDF Format)
Source: Defra - March 2003