


Food Outlook – Global Market Analysis – June 2011
A resurgence of avian influenza and high feed prices may halve poultry meat output growth, according to the latest Food Outlook report from the UN Food and Agriculture Organization (FAO). 5 July 2011
 8 minute read
Meat and Meat Products Market Summary
According to FAO, high feed prices, disease outbreaks and depleted animal inventories are forecast to limit the expansion of global meat production to only one per cent in 2011, to 294 million tonnes. The increase is anticipated to be driven by gains in the poultry and pig meat sectors, while world bovine and ovine meat outputs are expected to be constrained by a retention of animals for herd rebuilding.
Strong demand for imports, especially in Asia where a number of countries are facing tight supplies and high domestic prices, is expected to foster a 2.4 per cent growth in world meat trade, bringing it to 26.8 million tonnes. Much of the expansion would stem from increased flows of pig meat, and to a lower extent, poultry and bovine meats. On the other hand, trade in ovine meat may stagnate, limited by short availabilities in traditional exporting countries.
Relatively high retail prices are foreseen to keep per capita meat consumption in 2011 stalling around 41.9kg. In the developing countries, steady economic growth may foster a minimal increase to 32.0kg, while per capita consumption in the developed countries is expected to remain at 78.4kg.
International meat prices have maintained steady increases since January 2011, progressing by five per cent over the first quarter, mainly sustained by a 10 per cent increase in pig meat prices. In the near term, the combination of strong world import demand and limited export availabilities points toward a further firming of world meat prices in the next few months.
| World meat markets at a glance (FAO Food Outlook report, 2011) |
||||
|---|---|---|---|---|
| 2009 | 2010 est. |
2011 f'cast |
Change 2011 over 2010 |
|
| million tonnes | % | |||
| WORLD BALANCE | ||||
| Production | 283.2 | 290.6 | 294.0 | 1.1 |
| Bovine meat | 64.9 | 64.9 | 65.0 | 0.2 |
| Poultry meat | 93.6 | 98.0 | 100.2 | 2.3 |
| Pig meat | 106.3 | 109.2 | 110.0 | 0.7 |
| Ovine meat | 12.9 | 13.0 | 13.1 | 0.5 |
| Trade | 25.2 | 26.2 | 26.8 | 2.4 |
| Bovine meat | 7.2 | 7.5 | 7.7 | 1.9 |
| Poultry | 11.1 | 11.5 | 11.7 | 1.6 |
| Pig meat | 5.8 | 6.1 | 6.4 | 5.0 |
| Ovine meat | 0.9 | 0.8 | 0.8 | 0.8 |
| SUPPLY AND DEMAND INDICATORS Per capita food consumption (kg/year): |
||||
| World | 41.3 | 41.9 | 41.9 | 0.1 |
| Developed | 78.0 | 78.4 | 78.4 | 0.0 |
| Developing | 31.1 | 31.8 | 32.0 | 0.5 |
| FAO MEAT PRICE INDEX (2002-2004=100) |
2009 | 2010 | 2011 Jan-May |
Change: Jan-May 2011 over Jan-May 2010 (%) |
| 133 | 152 | 175 | 19.9 | |
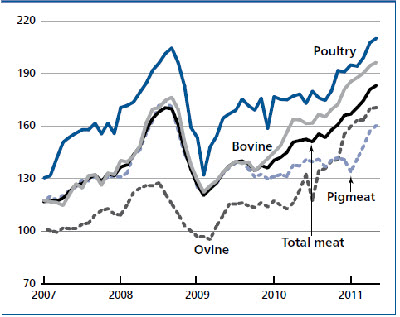
(2002-2004 = 100)
POULTRY MEAT
World poultry meat output is forecast by FAO to grow by two per cent to 100 million tonnes in 2011, half the rate of the previous year, as high feed costs and diseases constrain the profitability of the sector. However, its growth remains much faster than that predicted for the other meat sectors.
High feed prices are currently challenging supply growth in Brazil, China, the EU and the United States, which, together, account for nearly two-thirds of global output. In China, although the sector is benefiting from increased availability of breeding stock, high prices of other meats and restrictions on imports, rising costs are expected to slow down production expansion from the seven per cent reported in 2010 to three per cent in 2011. In the EU, only slight gains are anticipated, as the sector adjusts to the higher costs of production deriving from new EU broiler welfare rules implemented in 2011. Output gains in Brazil and the United States will be supported by strong consumer demand due to lower relative prices of poultry meat compared with other meats. In the Russian Federation, poultry investments estimated at nearly US$2 billion in 2010, and policies focused on enhancing meat self-sufficiency, in particular through import barriers and the provision of subsidised feed, will keep production gains at near double-digit figures.
Meanwhile, the FAO Food Outlook report adds, there has been a near record resurgence of avian influenza outbreaks since early January in Hong Kong, Japan, Myanmar, the Republic of Korea and Viet Nam, with the virus still circulating in Bangladesh, Egypt and Indonesia and other countries. This has reminded the global community of the potential threat of H5N1 and other diseases to national and global health. Diseases are largely behind the expectation of a halving of production growth in Asia to two per cent, notwithstanding expectations of output gains in India, Turkey and other smaller markets, such as the Islamic Republic of Iran, Iraq, Kazakhstan, Nepal and Turkey, where the number of poultry farms doubled last year.
| * "A resurgence of avian influenza and high feed prices may halve poultry meat output growth" |
Poultry meat exports in 2011 are expected by FAO to expand by 1.6 per cent to 11.7 million tonnes, substantially slower than the four per cent growth recorded last year. In Asia, shipments to the Republic of Korea will be supported by the recent opening of a 50,000 tonne tariff-free quota and vigorous consumer demand. Imports to Japan, the Hong Kong SAR of the People's Republic of China and Viet Nam as well as to Middle East countries are all forecast up. Purchases by Japan may for the first time surpass the one million tonne threshold, as additional supplies are needed not only to compensate for the declining production but also to respond to a possible shift of consumers away from fish, which may especially favour poultry.
In South Africa, the 2011 expiration of 10-year-old anti-dumping tariffs against poultry from the United States may support additional imports. Those increases are likely to more than offset reduced purchases in several important markets.
In the EU, lower imports are expected in response to the shifting definition of the use of frozen poultry and confusions about the EU-27 licensing system applied in 2010, a policy move that may prompt a WTO appeal by Brazil.
Deliveries to the Russian Federation, previously the world's largest poultry market, are expected to contract for the fourth consecutive year, following the halving of the country's TRQ to 350,000 tonnes. Likewise, China may cut poultry imports, owed to the imposition of anti-dumping and countervailing duties against product from the United States, China's principal supplier.
Among exporters, the United States is expected to witness a contraction of sales in 2011, which may even lead to its relinquishing its position as the world's top poultry exporter. The fall would mainly reflect tight domestic supplies but would also be due to market restrictions in China and the Russian Federation. Consequently, Brazil is likely to turn into the world's largest poultry exporter in 2011, with deliveries to foreign markets expected to exceed four million tonnes, equivalent to over one-third of global trade prospects.
Exports from Thailand are expected to expand, sustained by larger sales of cooked poultry products to both the EU and Japan. Continued investments in poultry operations in China may result in increased poultry deliveries, especially to other Asian countries.
| Poultry meat statistics (thousand tonnes, carcass weight equivalent) (FAO Food Outlook report, 2011) |
||||||||
|---|---|---|---|---|---|---|---|---|
| Production | Imports | Exports | Utilisation | |||||
| 2010 est. | 2011 f'cast | 2010 est. | 2011 f'cast | 2010 est. | 2011 f'cast | 2010 est. | 2011 f'cast | |
| ASIA | 34,640 | 35,421 | 6,057 | 6,382 | 2,032 | 2,198 | 38,665 | 39,611 |
| China | 17,601 | 18,102 | 1,815 | 1,890 | 1,056 | 1,143 | 18,360 | 18,849 |
| - of which Hong Kong, SAR | 45 | 45 | 1,039 | 1,145 | 550 | 600 | 534 | 590 |
| India | 2,670 | 2,720 | – | – | 2 | 2 | 2,668 | 2,718 |
| Indonesia | 1,435 | 1,438 | 7 | 7 | – | – | 1,442 | 1,445 |
| Iran, Isl. Rep. | 1,765 | 1,820 | 45 | 55 | 28 | 30 | 1,782 | 1,845 |
| Japan | 1,392 | 1,322 | 973 | 1,030 | 10 | 10 | 2,355 | 2,342 |
| Korea, Rep. | 647 | 660 | 117 | 121 | 17 | 16 | 747 | 765 |
| Kuwait | 44 | 44 | 300 | 320 | 1 | 1 | 343 | 364 |
| Malaysia | 1,100 | 1,120 | 32 | 30 | 22 | 25 | 1,110 | 1,125 |
| Saudi Arabia | 590 | 600 | 684 | 726 | 3 | 3 | 1,271 | 1,323 |
| Singapore | 95 | 100 | 123 | 120 | 7 | 7 | 211 | 214 |
| Thailand | 1,208 | 1,305 | 1 | 1 | 659 | 725 | 550 | 587 |
| Turkey | 1,300 | 1,400 | 95 | 105 | 120 | 130 | 1,275 | 1,375 |
| Yemen | 145 | 147 | 110 | 115 | – | – | 255 | 262 |
| AFRICA | 3,990 | 4,034 | 1,132 | 1,214 | 39 | 42 | 5,083 | 5,206 |
| Angola | 8 | 8 | 185 | 195 | – | – | 193 | 203 |
| South Africa | 1,020 | 1,028 | 253 | 266 | 31 | 35 | 1,242 | 1,259 |
| CENTRAL AMERICA | 4,028 | 4,081 | 1,239 | 1,316 | 40 | 42 | 5,227 | 5,355 |
| Cuba | 34 | 34 | 240 | 270 | – | – | 274 | 304 |
| Mexico | 2,659 | 2,699 | 700 | 736 | 14 | 16 | 3,345 | 3,419 |
| SOUTH AMERICA | 17,047 | 17,655 | 407 | 466 | 4,250 | 4,451 | 13,204 | 13,670 |
| Argentina | 1,346 | 1,472 | 7 | 6 | 250 | 293 | 1,103 | 1,185 |
| Brazil | 11,787 | 12,200 | 1 | 1 | 3,873 | 4,028 | 7,915 | 8,173 |
| Chile | 620 | 625 | 70 | 85 | 107 | 108 | 583 | 602 |
| Venezuela | 740 | 730 | 237 | 275 | – | – | 977 | 1,005 |
| NORTH AMERICA | 20,820 | 21,099 | 298 | 306 | 4,019 | 3,852 | 17,117 | 17,557 |
| Canada | 1,223 | 1,247 | 192 | 200 | 186 | 191 | 1,229 | 1,257 |
| USA | 19,597 | 19,852 | 95 | 95 | 3,833 | 3,661 | 15,877 | 16,289 |
| EUROPE | 16,398 | 16,863 | 1,853 | 1,540 | 1,068 | 1,045 | 17,182 | 17,359 |
| European Union | 12,272 | 12,321 | 806 | 805 | 1,010 | 986 | 12,068 | 12,140 |
| Russian Fed. | 2,635 | 2,872 | 672 | 403 | 8 | 8 | 3,300 | 3,268 |
| Ukraine | 900 | 1,063 | 156 | 105 | 17 | 18 | 1,040 | 1,151 |
| OCEANIA | 1,049 | 1,067 | 61 | 64 | 33 | 33 | 1,076 | 1,096 |
| Australia | 886 | 900 | 7 | 9 | 26 | 26 | 867 | 881 |
| New Zealand | 140 | 144 | 1 | – | 7 | 7 | 134 | 138 |
| WORLD | 97,972 | 100,220 | 11,047 | 11,288 | 11,482 | 11,664 | 97,554 | 99,853 |
| Developing countries |
56,579 | 58,107 | 7,400 | 7,859 | 6,311 | 6,677 | 57,669 | 59,295 |
| Developed countries |
41,393 | 42,113 | 3,646 | 3,429 | 5,171 | 4,986 | 39,886 | 40,558 |
| LIFDCs | 26,273 | 26,849 | 2,341 | 2,404 | 546 | 580 | 28,067 | 28,673 |
| LDCs | 1,821 | 1,807 | 707 | 749 | – | – | 2,528 | 2,556 |
| LIFDCs = Low-Income, Food-Deficit Countries LDCs = Less Developed Countries |
||||||||
Further Reading
| - | You can view the full report by clicking here. |
July 2011

 20 May 2025
3
minute read
20 May 2025
3
minute read