

GLOBAL POULTRY TRENDS 2013: Egg Trade of Little Importance in the Americas
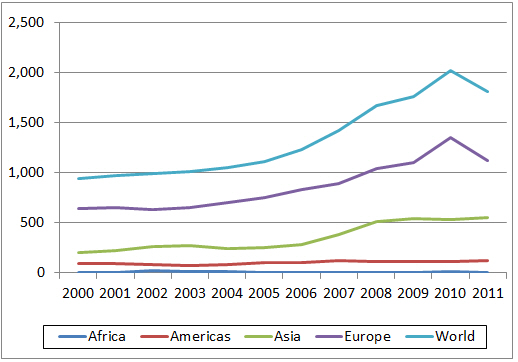
While world trade in shell eggs almost doubled between 2000 and 2010 and fell back somewhat in 2011, the Americas accounted for just seven per cent of global exports in 2011 and less than four per cent of imports, writes industry analyst, Terry Evans. The growth in dried egg exports from Argentina is remarkable over this period.Worldwide exports of eggs in shell more than doubled between 2000 and 2010 to exceed two million tonnes, but then slipped back towards 1.8 million tonnes in 2011 (Table 1 and Figure 1).
| Table 1. Global trade in hen eggs in shell ('000 tonnes) (Source: FAO) |
|||||||
| Exports | 2000 | 2006 | 2007 | 2008 | 2009 | 2010 | 2011 |
|---|---|---|---|---|---|---|---|
| Africa | 6.2 | 5.9 | 3.7 | 5.7 | 6.6 | 11.4 | 7.4 |
| Americas | 93.0 | 102.0 | 128.9 | 114.2 | 109.8 | 114.9 | 126.6 |
| Asia | 204.1 | 287.6 | 386.4 | 514.7 | 539.4 | 536.8 | 552.8 |
| Europe | 640.7 | 835.1 | 894.8 | 1,037.5 | 1,105.6 | 1,353.3 | 1,118.9 |
| World | 944.8 | 1,231.6 | 1,418.8 | 1,674.1 | 1,765.1 | 2,021.2 | 1,809.4 |
| Imports | 2000 | 2006 | 2007 | 2008 | 2009 | 2010 | 2011 |
| Africa | 25.7 | 48.0 | 51.0 | 50.2 | 46.1 | 54.4 | 63.4 |
| Americas | 66.3 | 67.6 | 62.3 | 74.1 | 67.2 | 66.2 | 66.7 |
| Asia | 235.8 | 284.8 | 369.8 | 430.9 | 464.4 | 498.4 | 558.6 |
| Europe | 557.5 | 802.1 | 983.4 | 1,024.1 | 1,047.8 | 1,060.0 | 990.6 |
| World | 886.0 | 1,204.8 | 1,468.0 | 1,581.0 | 1,627.9 | 1,681.8 | 1,681.2 |
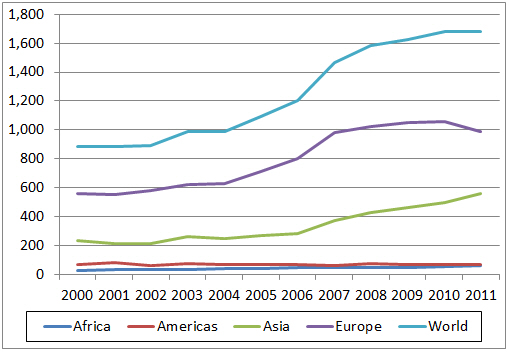
These indicate that the growth in trade has been due primarily to the movement of eggs from Europe and to a lesser extent Asia, as these two regions accounted for more than 92 per cent of global exports in 2011. The trends for regional imports of shell eggs (Table 1 and Figure 2) tell an almost identical story.
It is apparent from trade tables that the quantities exported and imported in a year often do not balance. There are many reasons for this though not all may apply to the shell hen eggs trade, including:
- Some countries provide data on a general rather than specific product basis.
- Data may be presented on a financial or market year rather than a calendar year.
- There is a time lag between product leaving a country in say December and arriving at its destination in say January of the following year.
- There can be a misclassification of a product between the exporter and importer.
- There can be place-of-origin/final destination inconsistencies. For example country (A) may report that the final destination is country C, but the goods actually reach C via another country (B). As a result country C may report the place of origin of the goods was country B.
In addition, goods can be lost during transport, while occasionally differences can occur due to a typing or calculation error. And, in some instances, trade may not be declared to circumvent an embargo or avoid tax payments.
The Americas accounted for just seven per cent of global exports in 2011 and less than four per cent of imports, assuming that the export total for that year was the actual quantity imported. Details of exports from and imports to the individual countries in this region are presented in tables 2 and 3.
| Table 2. Hen egg exports in shell from countries in the Americas (tonnes) (Source: FAO) |
|||||||
| Country | 2000 | 2006 | 2007 | 2008 | 2009 | 2010 | 2011 |
|---|---|---|---|---|---|---|---|
| Argentina | 30 | 2,542 | 2,141 | 1,417 | 1,486 | 1,080 | 1,051 |
| Bahamas | 0 | 41 | 27 | 28 | 0 | 0 | 0 |
| Barbados | 0 | 10 | 11 | 18 | 19 | 23 | 19 |
| Bolivia | 236 | 49 | 12 | 0 | 0 | 0 | 0 |
| Brazil | 4,394 | 14,226 | 16,488 | 9,559 | 10,035 | 13,930 | 14,170 |
| Canada | 2,072 | 2,059 | 3,469 | 2,187 | 1,920 | 2,566 | 2,360 |
| Chile | 551 | 312 | 634 | 324 | 31 | 53 | 23 |
| Colombia | 3,370 | 58 | 3,882 | 15,117 | 1,283 | 72 | 6 |
| Costa Rica | 499 | 1,875 | 488 | 876 | 1,237 | 1,021 | 2,096 |
| Ecuador | 5,866 | 165 | 187 | 38 | 0 | 254 | 0 |
| El Salvador | 9,569 | 2,378 | 2,471 | 2,508 | 2,097 | 736 | 94 |
| Guatemala | 688 | 313 | 253 | 103 | 247 | 74 | 120 |
| Guyana | 0 | 0 | 90 | 0 | 0 | 0 | 2 |
| Honduras | 99 | 222 | 317 | 129 | 502 | 570 | 274 |
| Jamaica | 0 | 0 | 0 | 20 | 21 | 0 | 0 |
| Mexico | 58 | 27 | 15 | 107 | 910 | 2,771 | 7,216 |
| Nicaragua | 98 | 0 | 0 | 0 | 0 | 0 | 0 |
| Panama | 578 | 1,308 | 1,596 | 1,416 | 1,181 | 1,082 | 974 |
| Peru | 187 | 2,268 | 2,445 | 3,150 | 3,236 | 4,419 | 4,077 |
| Trinidad/Tobago | 10 | 16 | 11 | 8 | 16 | 16 | 16 |
| US | 64,582 | 73,940 | 94,328 | 77,094 | 85,458 | 86,103 | 93,962 |
| Uruguay | 138 | 108 | 0 | 134 | 133 | 133 | 140 |
| Venezuela Bol. Rep. | 0 | 44 | 34 | 0 | 0 | 1 | 0 |
| AMERICAS | 93,025 | 101,961 | 128,899 | 114,233 | 109,812 | 114,906 | 126,607 |
| WORLD | 944,793 | 1,231,590 | 1,414,784 | 1,674,065 | 1,765,121 | 2,021,225 | 1,809,404 |
Shell Egg Trade
While global exports of shell eggs expanded by six per cent per year from 2000 to 2011, sales from countries in the Americas grew at less than half this rate. Even in 2011, they amounted to less than 127,000 tonnes. Although nearly 20 countries were involved in this trade in 2011, more than 91 per cent of the business was conducted by just three – the US (94,000 tonnes), Brazil (14,200 tonnes) and Mexico (7,200 tonnes). Of the others, Peru (4,100 tonnes) and Costa Rica (2,100 tonnes) have greatly increased their exports since 2000.
| Table 3. Hen egg imports in shell into countries in the Americas (tonnes) (Source: FAO) |
|||||||
| Country | 2000 | 2006 | 2007 | 2008 | 2009 | 2010 | 2011 |
|---|---|---|---|---|---|---|---|
| Antigua/Barbuda | 0 | 73 | 134 | 197 | 197 | 13 | 25 |
| Argentina | 2,394 | 0 | 3 | 10 | 0 | 0 | 3 |
| Aruba | 80 | 123 | 140 | 0 | 1,062 | 1,023 | 1,029 |
| Bahamas | 24 | 377 | 377 | 557 | 869 | 1,334 | 1,126 |
| Barbados | 520 | 775 | 862 | 759 | 870 | 796 | 793 |
| Belize | 125 | 86 | 69 | 87 | 99 | 102 | 116 |
| Bermuda | 30 | 431 | 488 | 525 | 486 | 511 | 531 |
| Bolivia | 29 | 33 | 37 | 38 | 42 | 29 | 74 |
| Brazil | 25 | 247 | 282 | 369 | 169 | 122 | 165 |
| Canada | 23,286 | 21,894 | 20,058 | 24,933 | 27,696 | 24,904 | 23,199 |
| Cayman Isl. | 200 | 23 | 29 | 101 | 101 | 87 | 122 |
| Chile | 39 | 35 | 36 | 32 | 36 | 31 | 78 |
| Colombia | 1,298 | 145 | 333 | 133 | 37 | 108 | 159 |
| Costa Rica | 498 | 320 | 436 | 317 | 469 | 620 | 294 |
| Cuba | 5 | 0 | 143 | 0 | 0 | 0 | 0 |
| Dominican Rep. | 330 | 1,694 | 255 | 108 | 1,015 | 1,284 | 210 |
| Ecuador | 590 | 2,030 | 2,503 | 3,195 | 3,521 | 4,198 | 3,516 |
| El Salvador | 1,178 | 2,432 | 576 | 182 | 524 | 803 | 611 |
| Grenada | 0 | 6 | 0 | 0 | 32 | 5 | 3 |
| Guatemala | 294 | 1,595 | 900 | 197 | 1,359 | 1,597 | 1,281 |
| Guyana | 872 | 1,948 | 1,435 | 1,682 | 1,243 | 1,693 | 1,692 |
| Haiti | 9 | 189 | 280 | 455 | 588 | 467 | 524 |
| Honduras | 9,113 | 2,562 | 2,939 | 3,342 | 2,011 | 900 | 900 |
| Jamaica | 3,000 | 4,614 | 4,169 | 3,946 | 4,000 | 3,830 | 3,873 |
| Mexico | 9,495 | 13,685 | 8,804 | 5,513 | 7,594 | 7,330 | 11,463 |
| Netherlands Antilles | 70 | 104 | 431 | 500 | 351 | 294 | - |
| Nicaragua | 1,732 | 2,582 | 2,606 | 3,069 | 3,197 | 3,693 | 4,063 |
| Panama | 136 | 130 | 18 | 5 | 132 | 33 | 72 |
| Paraguay | 216 | 0 | 586 | 1,165 | 805 | 1,097 | 1,304 |
| Peru | 224 | 145 | 65 | 54 | 791 | 178 | 33 |
| Saint Kitts/Nevis | 22 | 28 | 18 | 11 | 43 | 1,870 | 1,870 |
| Saint Lucia | 18 | 12 | 7 | 8 | 36 | 45 | 45 |
| Saint Pierre/Miquelon | 0 | 3 | 5 | 3 | 8 | 6 | 2 |
| Saint Vincent/Grenadines | 0 | 20 | 48 | 11 | 11 | 24 | 4 |
| Suriname | 110 | 159 | 226 | 220 | 301 | 302 | 316 |
| Trinidad/Tobago | 2,765 | 3,156 | 3,285 | 2,989 | 3,203 | 2,801 | 2,882 |
| US | 3,576 | 3,719 | 3,354 | 3,396 | 2,830 | 3,441 | 4,047 |
| Uruguay | 59 | 52 | 51 | 39 | 28 | 28 | 191 |
| Venezuela Bol. Rep. | 3,935 | 2,172 | 6,332 | 15,909 | 1,322 | 553 | 74 |
| AMERICAS | 66,297 | 67,599 | 62,320 | 74,057 | 67,078 | 66,214 | 66,690 |
| WORLD | 886,023 | 1,204,805 | 1,468,005 | 1,580,962 | 1,627,866 | 1,681,751 | 1,681,176 |
Clearly the United States is the leading exporter, shipping eggs to more than 80 countries in 2011, though almost 72,700 tonnes or 77 per cent of the total went to only three countries in almost equal quantities – mainland China, Hong Kong and Canada. After these, Mexico was the next important customer taking almost 7,200 tonnes, which increased to 12,100 tonnes in 2012 as it made up for a short-fall in domestic production due to the avian influenza outbreaks.
Of Brazil’s exports totalling 14,170 tonnes in 2011, nearly two-thirds were sold to Venezuela (9,100 tonnes), with both Paraguay and the United Arab Emirates purchasing more than 1,200 tonnes.
Shell egg imports into countries in the Americas hardly changed over the 10 years or so averaging less than 70,000 tonnes a year. As Table 3 reveals, the leading buyer in 2011 was Canada with almost 23,200 tonnes, followed by Mexico with 11,500 tonnes and the USA, Nicaragua, each taking around 4,000 tonnes.
Dried Egg Product Trade
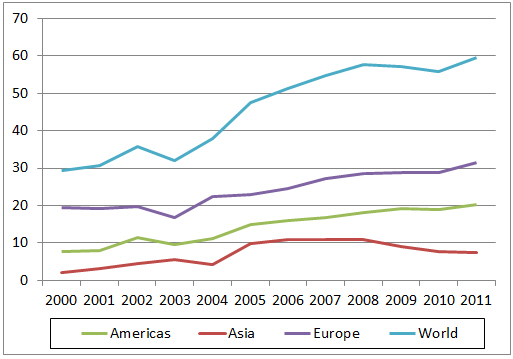
Since 2007, global exports of dried egg powder have amounted to between 55,000 and 60,000 tonnes a year, roughly equivalent to some 300,000 tonnes of shell eggs. The volume traded has doubled since 2000 (Figure 1) with all the major regions exhibiting growth.
The bulk of the business has been conducted by countries in Europe and the Americas. However, it is the Americas region that has recorded the more rapid growth in this business. Back in 2000, sales from this region amounted to less than 8,000 tonnes (27 per cent) of the global total of 29,400 tonnes. For Europe, the corresponding figures were 19,500 tonnes and 66 per cent. By 2011, the Americas shipped some 20,300 tonnes (34 per cent), while Europe sold 31,400 tonnes (53 per cent).
In the Americas (Table 4), the United States has been the major player for more than a decade as sales have climbed from a little over 4,000 tonnes to around 15,000 tonnes a year. Japan was the top buyer of US product in 2011 taking almost 5,500 tonnes, followed by Germany with 2,400 tonnes, Canada 1,500 tonnes, Mexico 1,300 tonnes and Sweden with 1,100 tonnes. By 2012, US exports of dried products had risen to 18,500 tonnes.
However, the big surprise in this export business has been the growth in sales from Argentina which have spiralled from a mere 130 tonnes back in 2000 to almost 4,400 tonnes in 2011. In that year, some 870 tonnes were shipped to Denmark, 820 tonnes to Austria, 680 tonnes to the Russian Federation, 360 tonnes to Germany and almost 290 tonnes to Japan. Latest figures for 2012 indicate that Argentina’s dried egg exports have continued to expand to almost 5,300 tonnes.
| Table 4. Exports of dried egg from countries in the Americas (tonnes) (Source: FAO) Figures exclude dried albumen |
|||||||
| Country | 2000 | 2006 | 2007 | 2008 | 2009 | 2010 | 2011 |
|---|---|---|---|---|---|---|---|
| Argentina | 130 | 2,359 | 2,725 | 2,998 | 2,148 | 2,595 | 4,352 |
| Brazil | 434 | 364 | 403 | 153 | 152 | 24 | 9 |
| Canada | 2,837 | 3,373 | 2,188 | 1,893 | 1,458 | 1,021 | 874 |
| Chile | 96 | 28 | 25 | 73 | 40 | 0 | 0 |
| Colombia | 0 | 0 | 0 | 4 | 0 | 1 | 0 |
| El Salvador | 17 | 0 | 0 | 0 | 0 | 0 | 0 |
| Guatemala | 1 | 0 | 3 | 0 | 0 | 0 | 0 |
| Guyana | 0 | 0 | 0 | 0 | 0 | 11 | 0 |
| Mexico | 46 | 55 | 31 | 59 | 91 | 1 | 226 |
| Peru | 0 | 10 | 21 | 10 | 11 | 4 | 0 |
| US | 4,238 | 9,917 | 11,323 | 12,757 | 15,156 | 15,348 | 14,797 |
| Uruguay | 0 | 0 | 0 | 0 | 1 | 1 | 1 |
| AMERICAS | 7,799 | 16,106 | 16,719 | 17,947 | 19,057 | 19,006 | 20,259 |
| WORLD | 29,412 | 51,420 | 54,735 | 57,614 | 57,074 | 55,800 | 59,534 |
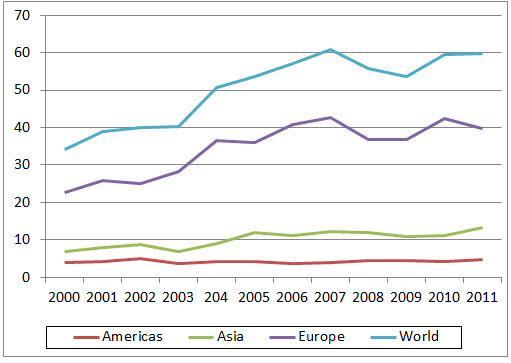
While the regional picture of dried egg imports (Figure 4) reveals that Europe is again the leading player accounting for two-thirds of the global total, on this occasion Asia takes the number two spot with nearly 23 per cent of the business, while the Americas was responsible for purchasing just 4,600 tonnes or eight per cent.
Just two countries accounted for two-thirds of the dried egg imports into the Americas (Table 5) with Mexico (taking 1,573 tonnes) and Canada (1,493 tonnes), all of which were supplied by the US.
| Table 5. Imports of dried egg into countries in the Americas (tonnes) (Source: FAO) Figures exclude dried albumen |
|||||||
| Country | 2000 | 2006 | 2007 | 2008 | 2009 | 2010 | 2011 |
|---|---|---|---|---|---|---|---|
| Argentina | 366 | 3 | 0 | 56 | 97 | 290 | 358 |
| Bahamas | 0 | 93 | 163 | 134 | 1 | 46 | 54 |
| Barbados | 0 | 4 | 0 | 0 | 0 | 0 | 0 |
| Belize | 0 | 0 | 0 | 1 | 1 | 0 | 0 |
| Bolivia | 0 | 0 | 0 | 3 | 0 | 22 | 264 |
| Brazil | 65 | 14 | 5 | 0 | 0 | 0 | 0 |
| Canada | 1,280 | 651 | 891 | 1,138 | 1,508 | 1,819 | 1,493 |
| Chile | 20 | 32 | 64 | 20 | 44 | 40 | 71 |
| Colombia | 142 | 168 | 247 | 161 | 140 | 215 | 287 |
| Costa Rica | 2 | 53 | 41 | 59 | 63 | 47 | 41 |
| Cuba | 39 | 104 | 65 | 338 | 294 | 112 | 162 |
| Ecuador | 2 | 194 | 289 | 228 | 304 | 19 | 18 |
| El Salvador | 14 | 1 | 1 | 1 | 1 | 1 | 1 |
| Guatemala | 12 | 3 | 3 | 3 | 79 | 49 | 68 |
| Honduras | 0 | 0 | 0 | 2 | 0 | 3 | 4 |
| Jamaica | 0 | 9 | 4 | 25 | 26 | 11 | 4 |
| Mexico | 487 | 2,080 | 2,132 | 1,783 | 1,719 | 1,375 | 1,573 |
| Panama | 10 | 2 | 2 | 9 | 7 | 7 | 6 |
| Paraguay | 5 | 5 | 3 | 0 | 0 | 2 | 14 |
| Peru | 65 | 2 | 0 | 10 | 15 | 15 | 9 |
| Saint Lucia | 0 | 1 | 0 | 0 | 0 | 0 | 0 |
| Trinidad/Tobago | 114 | 203 | 105 | 147 | 160 | 160 | 112 |
| US | 475 | 56 | 2 | 280 | 8 | 16 | 1 |
| Uruguay | 71 | 21 | 15 | 16 | 29 | 66 | 82 |
| Venezuela Bol. Rep. | 856 | 14 | 5 | 22 | 11 | 15 | 0 |
| AMERICAS | 4,025 | 3,713 | 4,037 | 4,436 | 4,507 | 4,330 | 4,622 |
| WORLD | 34,244 | 56,954 | 60,850 | 55,672 | 53,671 | 59,408 | 59,732 |
Liquid Egg Product Trade
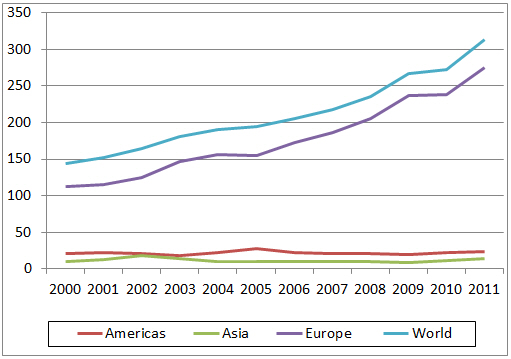
Worldwide exports of liquid egg escalated from 144,000 tonnes to 314,000 tonnes between 2000 and 2011. As Figure 5 reveals, this trade almost entirely revolves around sales from European countries these accounting for almost 88 per cent of the total business in 2011.
The quantities exported from the Americas have hardly changed over the past 10 years or more, amounting to nearly 24,000 tonnes in 2011 (Table 6). Of the total the US shipped almost 19,000 tonnes with 11,200 tonnes being purchased by Japan and 2,012 tonnes by Canada.
| Table 6. Exports of liquid egg from countries in the Americas (tonnes) (Source: FAO) |
|||||||
| Country | 2000 | 2006 | 2007 | 2008 | 2009 | 2010 | 2011 |
|---|---|---|---|---|---|---|---|
| Argentina | 18 | 239 | 237 | 179 | 173 | 192 | 71 |
| Brazil | 874 | 2,688 | 2,019 | 2,393 | 2,278 | 1,961 | 1,278 |
| Canada | 1,783 | 2,647 | 1,943 | 2,542 | 2,094 | 4,332 | 3,644 |
| Colombia | 0 | 0 | 1 | 0 | 0 | 0 | 0 |
| Costa Rica | 0 | 0 | 2 | 0 | 0 | 0 | 0 |
| El Salvador | 870 | 561 | 598 | 194 | 9 | 0 | 0 |
| Jamaica | 0 | 0 | 1 | 0 | 0 | 0 | 0 |
| Mexico | 0 | 0 | 0 | 5 | 57 | 177 | 104 |
| Peru | 553 | 0 | 124 | 462 | 214 | 28 | 44 |
| US | 16,548 | 15,889 | 15,335 | 14,973 | 14,343 | 14,961 | 18,651 |
| Uruguay | 0 | 12 | 5 | 3 | 13 | 13 | 13 |
| Venezuela Bol. Rep. | 1 | 22 | 6 | 0 | 0 | 0 | 0 |
| AMERICAS | 20,647 | 22,058 | 20,271 | 20,751 | 19,181 | 21,664 | 23,805 |
| WORLD | 144,191 | 205,274 | 217,255 | 235,998 | 266,462 | 272,639 | 313,984 |
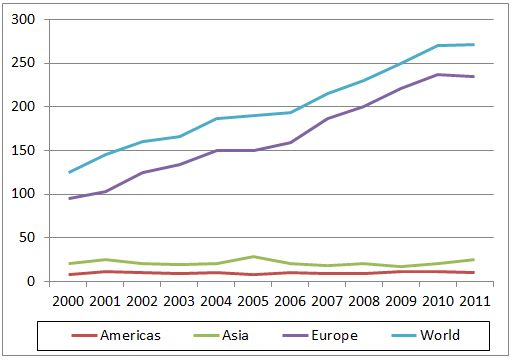
Quantities of liquid egg imported into the Americas are minimal amounting to around 10,000 tonnes a year (Table 7 and Figure 6) with the USA (3,800 tonnes), Canada (2,200 tonnes) and Mexico (1,400 tonnes) the man recipients.
| Table 7. Imports of liquid egg into countries in the Americas (tonnes) (Source: FAO) |
|||||||
| Country | 2000 | 2006 | 2007 | 2008 | 2009 | 2010 | 2011 |
|---|---|---|---|---|---|---|---|
| Antigua/Barbuda | 0 | 0 | 0 | 0 | 0 | 0 | 9 |
| Argentina | 546 | 12 | 4 | 0 | 12 | 0 | 0 |
| Aruba | 1 | 0 | 0 | 0 | 7 | 7 | 7 |
| Bahamas | 140 | 206 | 191 | 199 | 282 | 256 | 231 |
| Barbados | 15 | 25 | 37 | 46 | 64 | 87 | 108 |
| Bermuda | 100 | 50 | 44 | 29 | 4 | 1 | 1 |
| Bolivia | 8 | 0 | 0 | 4 | 1 | 0 | 1 |
| Canada | 1,857 | 2,066 | 2,430 | 1,905 | 3,985 | 2,284 | 2,191 |
| Chile | 0 | 25 | 9 | 6 | 98 | 186 | 21 |
| Colombia | 2 | 1 | 0 | 0 | 0 | 0 | 0 |
| Costa Rica | 382 | 851 | 378 | 584 | 380 | 426 | 567 |
| Cuba | 5 | 0 | 3 | 0 | 0 | 251 | 239 |
| Ecuador | 6 | 0 | 0 | 0 | 0 | 331 | 302 |
| El Salvador | 111 | 3 | 0 | 0 | 25 | 19 | 20 |
| Guatemala | 883 | 646 | 643 | 234 | 178 | 84 | 180 |
| Guyana | 0 | 0 | 3 | 0 | 0 | 0 | 0 |
| Haiti | 3 | 0 | 0 | 0 | 0 | 0 | 0 |
| Honduras | 98 | 37 | 17 | 35 | 12 | 1 | 1 |
| Jamaica | 3 | 1 | 2 | 1 | 27 | 0 | 2 |
| Mexico | 907 | 2,158 | 1,109 | 478 | 1,729 | 1,797 | 1,394 |
| Netherlands Antilles | 20 | 60 | 11 | 18 | 24 | 10 | - |
| Nicaragua | 0 | 3 | 2 | 1 | 1 | 1 | 1 |
| Panama | 100 | 19 | 24 | 26 | 20 | 21 | 30 |
| Paraguay | 3 | 1 | 0 | 0 | 0 | 0 | 0 |
| Peru | 290 | 145 | 127 | 93 | 0 | 0 | 0 |
| Saint Kitts/Nevis | 0 | 3 | 0 | 0 | 0 | 6 | 1 |
| Saint Lucia | 1 | 1 | 2 | 0 | 0 | 2 | 2 |
| Saint Vincent/Grenadines | 0 | 0 | 1 | 1 | 0 | 2 | 2 |
| Trindad/Tobago | 65 | 61 | 65 | 105 | 65 | 19 | 81 |
| US | 1,596 | 1,811 | 1,731 | 2,726 | 2,473 | 4,047 | 3,829 |
| Uruguay | 28 | 244 | 228 | 172 | 62 | 110 | 334 |
| Venezuela Bol. Rep. | 200 | 2,075 | 2,332 | 2,210 | 1,323 | 739 | 517 |
| AMERICAS | 7,370 | 10,504 | 9,393 | 8,873 | 10,779 | 10,687 | 10,079 |
| WORLD | 124,335 | 193,459 | 215,287 | 230,369 | 249,486 | 270,486 | 271,809 |
February 2014


