GLOBAL POULTRY TRENDS - A Quarter of the Population Will Live in Africa
The continent of Africa recorded substantial growth in poultry production since 2000, with South Africa one of the most important players in the region, writes industry analyst Terry Evans. 15 March 2016
 21 minute read
 By:
By: In terms of numbers there will be almost 1,300 million more people having to be fed there than today and even by 2030 the increase will be of the order of almost 500 million.
Regarding chicken meat production, currently Africa produces around 5 million tonnes a year or some 5 per cent of an estimated world output of 99 million tonnes (Table 1).
| Table 1. Indigenous* chicken meat production (million tonnes) | ||||||||||||
| Region | 2000 | 2005 | 2006 | 2007 | 2008 | 2009 | 2010 | 2011 | 2012 | 2013 | 2014E | 2015F |
|---|---|---|---|---|---|---|---|---|---|---|---|---|
| Africa | 2.8 | 3.3 | 3.4 | 3.7 | 4.0 | 4.2 | 4.5 | 4.5 | 4.6 | 4.7 | 4.9 | 4.9 |
| Americas | 27.1 | 32.7 | 33.7 | 35.0 | 37.5 | 36.9 | 38.8 | 40.0 | 40.5 | 42.1 | 42.8 | 43.4 |
| Asia | 18.6 | 22.4 | 23.5 | 25.0 | 26.2 | 28.0 | 29.2 | 30.3 | 31.6 | 32.2 | 32.1 | 32.7 |
| Europe | 9.5 | 10.9 | 10.8 | 11.6 | 12.1 | 13.3 | 13.9 | 14.6 | 15.5 | 16.1 | 16.5 | 16.7 |
| Oceania | 0.7 | 0.9 | 1.0 | 1.0 | 1.0 | 1.0 | 1.1 | 1.2 | 1.2 | 1.3 | 1.2 | 1.3 |
| WORLD | 58.7 | 70.3 | 72.3 | 76.2 | 80.7 | 83.4 | 87.4 | 90.6 | 93.3 | 96.3 | 97.5 | 99.0 |
| Broiler meat production (million tonnes) | ||||||||||||
| WORLD | 50.1 | 63.1 | 64.3 | 68.3 | 72.8 | 73.6 | 78.2 | 81.4 | 83.4 | 84.6 | 86.4 | 87.3 |
| *Meat from the slaughter of birds originating in a country, plus the meat equivalent of any such birds exported live. | ||||||||||||
| E 2014 and F 2015 author's estimates and forecasts for chicken meat, F 2015 USDA forecast for broiler meat. | ||||||||||||
| Regional figures may not add up to the world totals due to rounding. | ||||||||||||
| Source: FAO for chicken meat, USDA for broiler meat | ||||||||||||
Over the period 2000 to 2013, which is the last year for official data from the Food and Agriculture Organisation (FAO), production of chicken meat, table birds plus culled layers, in Africa expanded by a little over 4 per cent per year compared with a global figure of just under 4 per cent.
Consequently, Africa’s share of the world total has improved a shade from 4.7 to 4.9 per cent. Incidentally, for the same period the USDA, which makes assessments of global broiler production, calculates a growth rate of 4.1 per cent as output has climbed from 50.1 million tonnes to 84.6 million tonnes (Table 1).
Long-term forecasts for poultry meat production point to an annual growth of less than 2.5 per cent as the total amounts to around 134.5 million tonnes by 2023. As chicken meat represents around 88 per cent of poultry meat output, chicken production is likely to exceed 118 million tonnes at that time, with Africa supplying around 6 million tonnes.
Chicken meat production in Africa increased by almost 2 million tonnes between 2000 and 2013 with all bar a handful of countries recording substantial growth (Table 2).
| Table 2. Chicken meat production in Africa ('000 tonnes eviscerated weight) | |||||||
| Country | 2000 | 2005 | 2009 | 2010 | 2011 | 2012 | 2013 |
|---|---|---|---|---|---|---|---|
| Algeria | 235.3 | 249.6 | 249.5 | 249.6 | 253.8 | 255.9 | 261.3 |
| Angola | 7.6 | 7.5 | 15.6 | 19.0 | 21.8 | 25.4 | 29.7 |
| Benin | 12.2 | 15.4 | 21.4 | 22.2 | 23.5 | 23.7 | 24.1 |
| Botswana | 3.6 | 4.8 | 4.5 | 4.4 | 5.7 | 6.1 | 6.8 |
| Burkina Faso | 27.0 | 30.8 | 35.3 | 37.2 | 38.3 | 38.4 | 37.9 |
| Burundi | 5.8 | 6.5 | 6.7 | 6.8 | 6.8 | 3.8 | 3.6 |
| Cameroon | 21.2 | 53.2 | 63.8 | 67.8 | 69.8 | 70.2 | 71.8 |
| Cabo Verde | 0.4 | 0.4 | 0.5 | 0.5 | 0.5 | 0.6 | 0.8 |
| Central African Rep | 3.2 | 4.2 | 5.5 | 5.7 | 5.9 | 6.0 | 6.0 |
| Chad | 4.7 | 4.9 | 5.2 | 5.3 | 5.3 | 5.3 | 5.4 |
| Comoros | 0.5 | 0.5 | 0.5 | 0.6 | 0.6 | 0.6 | 0.6 |
| Congo | 4.4 | 5.6 | 6.0 | 6.2 | 6.5 | 6.6 | 6.7 |
| Congo Dem Rep | 11.4 | 10.5 | 10.4 | 10.4 | 10.5 | 11.2 | 11.3 |
| Cote d'Ivoire | 21.9 | 21.7 | 23.2 | 34.7 | 33.2 | 41.5 | 47.1 |
| Egypt | 511.8 | 569.7 | 671.2 | 744.0 | 796.2 | 822.3 | 834.1 |
| Equatorial Guinea | 0.2 | 0.2 | 0.2 | 0.2 | 0.2 | 0.2 | 0.2 |
| Eritrea | 1.7 | 2.1 | 1.6 | 1.7 | 1.7 | 1.7 | 1.7 |
| Ethiopia | 37.6 | 42.5 | 50.4 | 59.2 | 53.9 | 60.4 | 61.8 |
| Gabon | 3.7 | 3.6 | 3.5 | 3.5 | 3.5 | 3.6 | 3.7 |
| Gambia | 1.0 | 1.0 | 1.2 | 1.3 | 1.2 | 1.5 | 1.6 |
| Ghana | 19.0 | 26.5 | 32.9 | 35.6 | 36.9 | 42.7 | 47.4 |
| Guinea | 4.1 | 5.6 | 6.7 | 6.4 | 6.2 | 6.3 | 6.5 |
| Guinea-Bissau | 1.1 | 1.4 | 1.7 | 1.8 | 1.9 | 1.9 | 1.9 |
| Kenya | 18.6 | 24.6 | 28.6 | 30.9 | 26.5 | 24.7 | 25.8 |
| Lesotho | 1.8 | 2.1 | 1.9 | 1.6 | 1.6 | 1.6 | 1.6 |
| Liberia | 6.4 | 8.5 | 10.4 | 10.9 | 11.4 | 11.6 | 11.6 |
| Libya | 96.9 | 98.8 | 115.2 | 118.8 | 122.4 | 124.2 | 125.0 |
| Madagascar | 31.7 | 35.4 | 36.9 | 36.3 | 36.0 | 35.8 | 38.4 |
| Malawi | 15.3 | 15.8 | 21.3 | 21.4 | 22.4 | 22.5 | 22.8 |
| Mali | 29.2 | 34.9 | 41.0 | 41.7 | 41.3 | 42.1 | 44.3 |
| Mauritania | 4.0 | 4.3 | 4.3 | 4.5 | 4.5 | 4.6 | 4.6 |
| Mauritius | 21.1 | 33.3 | 44.9 | 46.5 | 48.4 | 48.6 | 48.4 |
| Morocco | 238.3 | 361.1 | 486.5 | 558.8 | 586.2 | 557.5 | 599.3 |
| Mozambique | 28.8 | 17.1 | 29.7 | 28.3 | 27.0 | 23.1 | 23.1 |
| Namibia | 4.0 | 3.5 | 6.8 | 6.8 | 7.2 | 7.6 | 7.7 |
| Niger | 11.0 | 11.7 | 16.2 | 16.6 | 16.6 | 16.8 | 17.2 |
| Nigeria | 158.8 | 218.5 | 272.9 | 245.0 | 144.7 | 155.5 | 170.0 |
| Reunion | 13.3 | 14.1 | 15.7 | 16.8 | 17.0 | 17.2 | 17.2 |
| Rwanda | 1.4 | 2.3 | 2.2 | 2.1 | 2.1 | 2.2 | 2.1 |
| Sao Tome/Principe | 0.6 | 0.7 | 0.7 | 0.7 | 0.7 | 0.7 | 0.7 |
| Senegal | 23.0 | 29.0 | 39.3 | 45.4 | 55.7 | 56.6 | 64.5 |
| Seychelles | 1.0 | 0.8 | 0.6 | 0.8 | 0.9 | 0.9 | 1.0 |
| Sierra Leone | 5.4 | 4.5 | 11.9 | 13.0 | 13.7 | 14.4 | 15.1 |
| Somalia | 3.2 | 3.7 | 3.1 | 3.5 | 3.5 | 3.6 | 3.6 |
| South Africa | 818.7 | 948.7 | 1387.3 | 1473.4 | 1485.6 | 1488.6 | 1497.0 |
| Sudan (former) | 25.8 | 26.0 | 27.3 | 37.3 | 39.3 | 44.3 | 44.3 |
| Swaziland | 3.8 | 5.2 | 4.3 | 4.7 | 4.8 | 4.9 | 4.9 |
| Tanzania Un Rep | 44.2 | 51.2 | 48.3 | 79.3 | 92.1 | 83.7 | 86.5 |
| Togo | 12.0 | 17.6 | 26.0 | 28.4 | 29.6 | 31.2 | 32.0 |
| Tunisia | 86.0 | 86.3 | 101.8 | 111.6 | 106.9 | 126.3 | 138.8 |
| Uganda | 43.6 | 50.4 | 50.3 | 56.3 | 60.1 | 60.1 | 61.6 |
| Zambia | 35.0 | 39.4 | 40.0 | 42.5 | 42.8 | 43.7 | 45.6 |
| Zimbabwe | 33.5 | 52.2 | 62.5 | 61.8 | 64.1 | 64.4 | 64.7 |
| AFRICA | 2755.4 | 3269.7 | 4155.2 | 4469.5 | 4498.9 | 4554.7 | 4691.0 |
| Source: FAO | |||||||
In 2013, close to 70 per cent of the regional total was produced in just four countries, South Africa, Egypt, Morocco and Algeria, whereas the top seven accounted for 3.63 million tonnes or some 77 per cent (Tables 2 and 3).
South Africa is easily the leading producer (Table 4 and figure 1). However, although expansion averaged 4.6 per cent per year between 2000 and 2010, since then annual output of chicken meat has shown little growth at around 1.5 million tonnes.
| Table 3. Chicken meat production ranking in Africa 2013 ('000 tonnes) | |||||||
| South Africa | 497.0 | ||||||
| Egypt | 834.1 | ||||||
| Morocco | 599.3 | ||||||
| Algeria | 261.3 | ||||||
| Nigeria | 170.0 | ||||||
| Tunisia | 138.8 | ||||||
| Libya | 125.0 | ||||||
| Tanzania Un Rep | 86.5 | ||||||
| Cameroon | 71.8 | ||||||
| Zimbabwe | 64.7 | ||||||
| Senegal | 64.5 | ||||||
| Ethiopia | 61.8 | ||||||
| Uganda | 61.6 | ||||||
| Mauritius | 48.4 | ||||||
| Ghana | 47.4 | ||||||
| Cote d'Ivoire | 47.1 | ||||||
| Zambia | 45.6 | ||||||
| Sudan (former) | 44.3 | ||||||
| Mali | 44.3 | ||||||
| Madagascar | 38.4 | ||||||
| Burkina Faso | 37.9 | ||||||
| Togo | 32.0 | ||||||
| Angola | 29.7 | ||||||
| Kenya | 25.8 | ||||||
| Benin | 24.1 | ||||||
| Mozambique | 23.1 | ||||||
| Malawi | 22.8 | ||||||
| Reunion | 17.2 | ||||||
| Niger | 17.2 | ||||||
| Sierra Leone | 15.1 | ||||||
| Liberia | 11.6 | ||||||
| Congo Dem Rep | 11.3 | ||||||
| Namibia | 7.7 | ||||||
| Botswana | 6.8 | ||||||
| Congo | 6.7 | ||||||
| Guinea | 6.5 | ||||||
| Central African Rep | 6.0 | ||||||
| Chad | 5.4 | ||||||
| Swaziland | 4.9 | ||||||
| Mauritania | 4.6 | ||||||
| Gabon | 3.7 | ||||||
| Somalia | 3.6 | ||||||
| Burundi | 3.6 | ||||||
| Rwanda | 2.1 | ||||||
| Guinea-Bissau | 1.9 | ||||||
| Eritrea | 1.7 | ||||||
| Lesotho | 1.6 | ||||||
| Gambia | 1.6 | ||||||
| Seychelles | 1.0 | ||||||
| Cabo Verde | 0.8 | ||||||
| Sao Tome/Principe | 0.7 | ||||||
| Comoros | 0.6 | ||||||
| Equatorial Guinea | 0.2 | ||||||
| Source: FAO | |||||||
| Table 4. Leading chicken meat producers in Africa ('000 tonnes) | |||||||||||
| Country | 2003 | 2004 | 2005 | 2006 | 2007 | 2008 | 2009 | 2010 | 2011 | 2012 | 2013 |
|---|---|---|---|---|---|---|---|---|---|---|---|
| South Africa | 898 | 907 | 949 | 971 | 1125 | 1328 | 1387 | 1473 | 1486 | 1489 | 1497 |
| Egypt | 563 | 585 | 570 | 617 | 705 | 629 | 671 | 744 | 796 | 822 | 834 |
| Morocco | 314 | 318 | 361 | 364 | 372 | 436 | 487 | 559 | 586 | 558 | 599 |
| Algeria | 251 | 250 | 250 | 249 | 250 | 251 | 250 | 250 | 254 | 256 | 261 |
| Nigeria | 200 | 210 | 219 | 232 | 243 | 260 | 273 | 245 | 145 | 156 | 170 |
| Tunisia | 89 | 95 | 86 | 78 | 95 | 102 | 102 | 112 | 107 | 126 | 139 |
| Source: FAO | |||||||||||
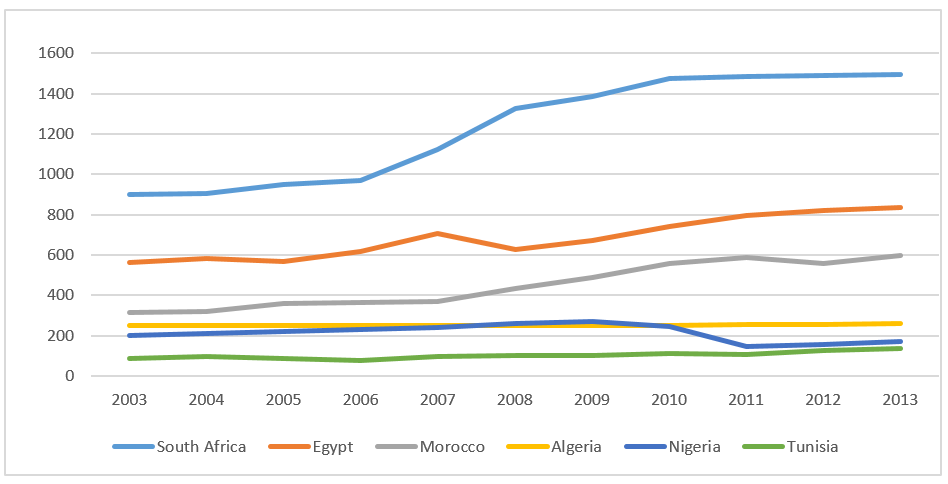
Figure 1. South Africa and Egypt head the group of leading producers in the region ('000 tonnes)
South African Poultry Association (SAPA) figures, which apply to commercial and subsistence chicken production, show a similar trend though at the higher level of 1.7 million tonnes for the latter years.
Another series, compiled by the USDA on broiler production in South Africa for the period 2013 to and including 2015 shows little change around an annual figure of 1.4 million tonnes.
While the demand for chicken continues to outstrip supply, South African producers are having to face increased competition from imports. Indeed, the Association foresees ongoing battles against unfair trade practices as one of the major challenges to industry growth. Nevertheless, it is anticipated that production could reach 1.8 million tonnes in the next decade.
Egypt is the second largest producer having managed a near 4 per cent per year growth rate between 2000 and 2013 as annual output expanded from 512,000 to 834,000 tonnes.
Among the largest producers, Morocco has recorded the most rapid increase since 2000, averaging over 7 per cent per year, as production more than doubled from 238,000 tonnes to 599,000 tonnes.
Although Algeria is among the leading producers actual output has changed little over the past decade or so at around 250,000 tonnes.
Having expanded from 159,000 tonnes in 2000 to 273,000 tonnes in 2009 Nigeria’s industry almost collapsed to 145,000 tonnes in 2011. Since then a slow recovery has ensued with output reaching 170,000 tonnes in 2013.
Chicken production in Tunisia has expanded by 3.8 per cent per year to a record high of 139,000 tonnes in 2013.
A moderate 2 per cent per year increase has pushed Libya’s output to 125,000 tonnes.
Of note is that quite a number of the smaller nations managed to more than double production during the review period.
Africa’s imports will continue to grow
World trade in frozen/fresh chicken meat almost doubled between 2000 and 2012 when it totalled 12.6 million tonnes (Table 5). In recent years however, global trade has slowed and appears to have even contracted in 2015, though forecasts point to a recovery in 2016.
| Table 5. World trade in fresh/frozen chicken meat ('000 tonnes) | |||||||
| Exports | 2000 | 2005 | 2008 | 2009 | 2010 | 2011 | 2012 |
|---|---|---|---|---|---|---|---|
| Africa | 9.5 | 4.8 | 9.5 | 46.3 | 61.5 | 14.4 | 14.3 |
| Americas | 3627.4 | 5517.2 | 7311.6 | 7235.3 | 7260.7 | 7539.5 | 7733.0 |
| Asia | 1432.2 | 420.6 | 765.8 | 876.5 | 1188.0 | 1373.1 | 1287.4 |
| Europe | 1805.1 | 2137.3 | 2344.7 | 2592.1 | 3115.7 | 3477.8 | 3547.9 |
| Oceania | 14.3 | 21.8 | 31.0 | 33.3 | 29.2 | 32.8 | 39.4 |
| WORLD | 6888.4 | 8101.7 | 10462.6 | 10783.5 | 11655.1 | 12437.6 | 12621.9 |
| Imports | |||||||
| Africa | 259.0 | 512.9 | 718.2 | 861.2 | 1069.0 | 1283.4 | 1550.4 |
| Americas | 556.0 | 912.2 | 1375.6 | 1384.4 | 1493.8 | 1505.2 | 1584.9 |
| Asia | 3276.7 | 2767.2 | 4274.9 | 4650.3 | 5021.5 | 5780.0 | 5328.6 |
| Europe | 1811.2 | 3223.6 | 3374.2 | 3095.0 | 2879.7 | 2790.3 | 3029.9 |
| Oceania | 26.4 | 35.5 | 38.1 | 44.0 | 48.8 | 59.2 | 66.4 |
| WORLD | 5929.3 | 7451.4 | 9781.0 | 10035.5 | 10512.8 | 11418.1 | 11560.1 |
| Source: FAO | |||||||
According to the FAO, world poultry meat trade slipped by 1 per cent in 2015 from 12.7 to 12.6 million tonnes. Similar to this, the USDA’s estimates of global broiler meat exports show a 2 per decline from 2014 to 2015 as the total fell from 10.47 million tonnes to 10.23 million tonnes.
However, the forecast for 2016 rises to 10.69 million tonnes. It should be noted that the data presented by both the FAO and the USDA excludes trade between EU member countries.
Exports of chicken meat from African countries are negligible and have actually declined from a peak of over 61,000 tonnes in 2010 to a mere 14,300 tonnes in 2012.
The picture on imports is markedly different. Here, the quantities involved increased sixfold over the review period to reach almost 1.6 million tonnes in 2012.
Reference to tables 6, 7 and figure 2 reveals that South Africa is the leading importer in the region taking almost 340,000 tonnes in 2012 followed by Angola with 301,000 tonnes, Ghana with 154,000 tonnes, Benin with almost 124,000 tonnes and Egypt with 110,000 tonnes.
| Table 6. Imports of fresh/frozen chicken meat by African countries (tonnes) | |||||||
| Country | 2000 | 2005 | 2008 | 2009 | 2010 | 2011 | 2012 |
|---|---|---|---|---|---|---|---|
| Angola | 47300 | 102812 | 170612 | 160770 | 238357 | 286761 | 301288 |
| Benin | 33030 | 29949 | 60602 | 75791 | 78070 | 104164 | 123773 |
| Botswana | 54 | 116 | 2331 | 2768 | 4260 | 3658 | 3648 |
| Burkina Faso | 0 | 0 | 0 | 4 | 14 | 5 | 7 |
| Burundi | 0 | 0 | 0 | 0 | 15 | 11 | 1 |
| Cameroon | 13481 | 5893 | 148 | 17 | 45 | 124 | 85 |
| Cape Verde | 1447 | 5027 | 5889 | 6534 | 7046 | 7050 | 6143 |
| Central Afr Rep | 0 | 46 | 82 | 163 | 192 | 256 | 624 |
| Chad | 9 | 235 | 30 | 30 | 74 | 65 | 257 |
| Comoros | 932 | 4843 | 5596 | 6805 | 10923 | 8017 | 12760 |
| Congo | 8959 | 11681 | 25641 | 50936 | 22187 | 79200 | 93767 |
| Congo Dem Rep | 11800 | 36692 | 52452 | 64672 | 58348 | 66384 | 70173 |
| Cote d'Ivoire | 1381 | 4894 | 832 | 804 | 697 | 945 | 826 |
| Djibouti | 420 | 3786 | 6214 | 4330 | 1348 | 714 | 4603 |
| Egypt | 4000 | 31 | 20900 | 56164 | 126041 | 34731 | 110372 |
| Equatorial Guinea | 3800 | 8058 | 12615 | 14415 | 13917 | 20178 | 19220 |
| Ethiopia | 1 | 1 | 2 | 0 | 0 | 1 | 1 |
| Gabon | 13399 | 26980 | 30410 | 44357 | 43686 | 54901 | 54617 |
| Gambia | 1790 | 4911 | 2475 | 4197 | 3558 | 5682 | 5293 |
| Ghana | 13865 | 49916 | 71731 | 78837 | 109179 | 155056 | 154366 |
| Guinea | 798 | 2564 | 3106 | 3100 | 5569 | 8202 | 7088 |
| Guinea-Bissau | 430 | 515 | 1029 | 979 | 1208 | 1450 | 1201 |
| Kenya | 1 | 0 | 402 | 660 | 958 | 1672 | 1827 |
| Lesotho | 4600 | 5250 | 5400 | 5500 | 8000 | 9000 | 9500 |
| Liberia | 2700 | 5812 | 7719 | 6481 | 11441 | 20397 | 22340 |
| Libyan Arab Jam | 651 | 10 | 0 | 0 | 0 | 23850 | 88631 |
| Madagascar | 0 | 0 | 101 | 0 | 161 | 553 | 0 |
| Malawi | 0 | 0 | 8 | 33 | 3 | 4 | 38 |
| Mali | 7 | 25 | 130 | 130 | 27 | 27 | 5 |
| Mauritania | 2786 | 4220 | 5423 | 8818 | 7306 | 11377 | 11902 |
| Mauritius | 2 | 224 | 190 | 124 | 146 | 117 | 93 |
| Morocco | 395 | 220 | 530 | 160 | 364 | 412 | 300 |
| Mozambique | 2900 | 13216 | 9199 | 12605 | 9748 | 12797 | 6573 |
| Namibia | 16909 | 9470 | 26936 | 3606 | 3245 | 9970 | 30148 |
| Niger | 10 | 16 | 1 | 1 | 118 | 298 | 530 |
| Nigeria | 0 | 39 | 600 | 32837 | 45032 | 1009 | 202 |
| Rwanda | 0 | 0 | 1 | 4 | 2 | 9 | 34 |
| Sao Tome/Principe | 0 | 549 | 721 | 680 | 1145 | 1131 | 1147 |
| Senegal | 413 | 11486 | 1100 | 1 | 0 | 0 | 0 |
| Seychelles | 329 | 349 | 988 | 1548 | 1767 | 2691 | 2746 |
| Sierra Leone | 1189 | 1472 | 4141 | 3838 | 6421 | 8840 | 18230 |
| South Africa | 66577 | 157392 | 169013 | 184522 | 219638 | 298560 | 339145 |
| Sudan (former) | 0 | 204 | 677 | 835 | 1623 | 3627 | - |
| Swaziland | 592 | 180 | 28 | 21 | 21 | 21 | 21 |
| Tanzania Un Rep | 74 | 494 | 1 | 0 | 72 | 786 | 671 |
| Togo | 1829 | 3167 | 11559 | 6876 | 6715 | 8972 | 10749 |
| Tunisia | 71 | 27 | 132 | 1102 | 2599 | 2529 | 5200 |
| Uganda | 13 | 0 | 2 | 7 | 17 | 351 | 682 |
| Zambia | 1 | 112 | 1 | 0 | 558 | 967 | 1606 |
| Zimbabwe | 24 | 57 | 655 | 15803 | 17123 | 25905 | 27948 |
| AFRICA | 258971 | 512932 | 718175 | 861865 | 1068984 | 1283427 | 1550416 |
| - no figure | |||||||
| Source: FAO | |||||||
| Table 7. Leading chicken meat importers in Africa ('000 tonnes) | |||||||||
| 2000 | 2005 | 2010 | 2011 | 2012 | 2013 | 2014 | 2015E | 2016F | |
|---|---|---|---|---|---|---|---|---|---|
| South Africa | 72 | 189 | 240 | 326 | 371 | 355 | 369 | 420 | 440 |
| Angola | 49 | 103 | 239 | 287 | 301 | 321 | 365 | 240 | 260 |
| Benin | 40 | 29 | 98 | 104 | 124 | 114 | 152 | 180 | - |
| Ghana | 12 | 51 | 109 | 155 | 155 | 169 | 144 | 140 | - |
| Congo | 21 | 29 | 84 | 77 | 94 | 81 | 93 | 100 | - |
| Dem Rep Congo | 15 | 38 | 60 | 67 | 69 | 62 | 74 | 78 | - |
| - No figure | |||||||||
| Source: USDA | |||||||||
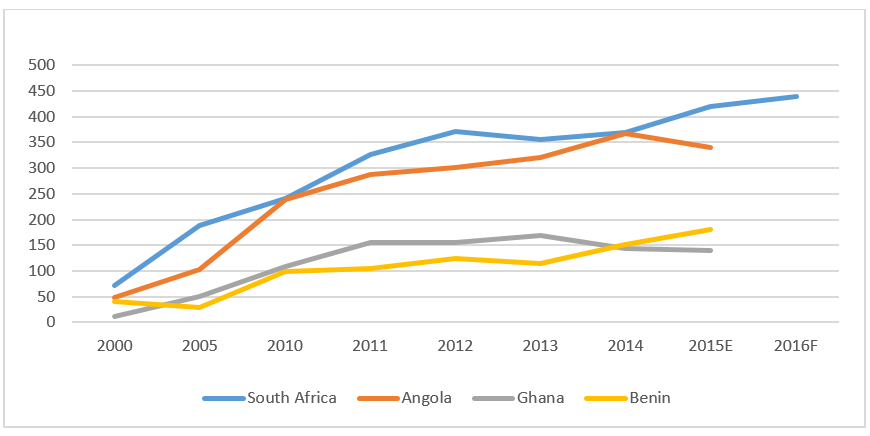
Figure 2. South Africa's chicken meat imports have escalated rapidly since 2000 ('000 tonnes)
In 2012, Brazil was the major supplier to South Africa shipping some 176,000 tonnes followed by the Netherlands with 54,000 tonnes, the UK (24,000 tonnes), Argentina (24,000 tonnes) and Germany (22,000 tonnes).
According to SAPA broiler imports in 2014 (almost 94 per cent of total poultry meat imports) amounted to 369,000 tonnes nearly all of which were frozen. While supplies from Brazil actually declined by nearly 9 per cent to 154,000 tonnes, receipts from EU member countries jumped by more than 27 per cent to 188,000 tonnes.
Interim anti-dumping tariffs, particularly in bone-in portions from the EU, have not proved effective and the Association considers that an alternative strategy is needed as South Africa is now the biggest single export destination for EU products.
Data produced by the USDA indicate that South Africa’s imports have since continued to rise the estimate for 2015 being 420,000 tonnes while the forecast for 2016 points to a new “high” of 440,000 tonnes.
South Africa has now begun to import US bone-in chicken after years of wrangling related to the African Growth and Opportunities Act.
It is envisaged that South Africa will continue to be a major importer of chicken meat as the annual average growth in production of a little under 3 per cent is outpaced by the anticipated growth in consumption of around 4.5 per cent. A forecast by the Standard Bank puts 2020 imports at almost 660,000 tonnes when they could represent some 28 per cent of domestic consumption.
According to FAO data, imports of fresh/frozen chicken meat into Angola escalated by a massive near 17 per cent per year since 2000 to exceed 301,000 tonnes in 2012 compared with only 47,300 tonnes back in 2000.
Data compiled by the USDA reveals that Angola’s poultry meat imports in 2012 came close to 324,000 tonnes and increased by 6 percent to more than 342,000 tonnes in 2013. Of the latter, almost 210,000 tonnes were supplied by the USA, while Brazil sent 100,000 tonnes.
The US has been highly successful in this market having sold only 140,000 tonnes back in 2010, against Brazil’s 112,000 tonnes. While Angola’s broiler production increased from a lowly 8,000 tonnes in 2004 to 26,000 tonnes in 2015, its imports rocketed from 86,000 tonnes to an estimated 367,000 tonnes in 2014, though are expected to decline to 340,000 tonnes this year.
The only other major importing country for which trade details are available is Ghana. In 2012 this country purchased more than 150,000 tonnes. The USA was the leading supplier with almost 43,000 tonnes, while both Brazil and Belgium supplied nearly 39,000 tonnes.
As was indicated earlier, chicken exports from African countries (Tables 5 and 8) have been insignificant in recent years. However, the latest data released by SAPA shows that South Africa’s poultry meat exports jumped to exceed 25,000 tonnes in 2013 and further to 66,000 tonnes in 2014, of which 93 per cent were chicken meat.
| Table 8. Exports of fresh/frozen chicken meat from African countries (tonnes) | |||||||
| Country | 2000 | 2005 | 2008 | 2009 | 2010 | 2011 | 2012 |
|---|---|---|---|---|---|---|---|
| Algeria | 0 | 1 | 0 | 0 | 6 | 33 | 5 |
| Benin | 722 | 0 | 4 | 30340 | 41807 | 0 | 0 |
| Botswana | 0 | 132 | 220 | 1 | 8 | 26 | 3 |
| Burundi | 0 | 0 | 2 | 0 | 0 | 0 | 0 |
| Cameroon | 1 | 6 | 0 | 1 | 1 | 0 | 0 |
| Cape Verde | 1 | 6 | 5 | 0 | 0 | 0 | 0 |
| Congo | 0 | 796 | 0 | 0 | 0 | 0 | 0 |
| Cote d'Ivoire | 2 | 1 | 3 | 20 | 17 | 12 | 31 |
| Egypt | 458 | 327 | 206 | 1928 | 1928 | 2165 | 693 |
| Gabon | 6 | 0 | 0 | 0 | 0 | 0 | 0 |
| Ghana | 14 | 64 | 0 | 18 | 0 | 0 | 5 |
| Kenya | 6 | 4 | 185 | 29 | 50 | 50 | 50 |
| Malawi | 0 | 0 | 0 | 0 | 0 | 2 | 10 |
| Mali | 0 | 25 | 0 | 0 | 84 | 84 | 0 |
| Mauritania | 0 | 0 | 0 | 0 | 28 | 0 | 0 |
| Mauritius | 10 | 20 | 0 | 0 | 1 | 92 | 12 |
| Morocco | 27 | 0 | 1800 | 32 | 34 | 34 | 27 |
| Namibia | 122 | 1208 | 4204 | 455 | 283 | 283 | 2335 |
| Senegal | 2 | 78 | 1 | 1 | 1 | 0 | 0 |
| Seychelles | 0 | 0 | 26 | 26 | 26 | 26 | 26 |
| South Africa | 6393 | 1513 | 2319 | 11802 | 14708 | 6789 | 7938 |
| Swaziland | 250 | 93 | 0 | 0 | 0 | 0 | 0 |
| Tanzania Un Rep | 160 | 0 | 0 | 0 | 0 | 1 | 0 |
| Togo | 175 | 0 | 0 | 307 | 248 | 138 | 0 |
| Tunisia | 0 | 0 | 393 | 1173 | 2228 | 4524 | 3058 |
| Uganda | 0 | 13 | 0 | 3 | 3 | 3 | 37 |
| Zambia | 46 | 0 | 31 | 22 | 8 | 50 | 33 |
| Zimbabwe | 1116 | 560 | 51 | 0 | 5 | 0 | 0 |
| AFRICA | 9512 | 4824 | 9502 | 46317 | 61526 | 14364 | 14339 |
| Source: FAO | |||||||
Growth double the world average
Population growth in Africa is double the global rate. In broad terms people numbers will increase by more than 2 per cent per year from now on, against less than 1 per cent for the world total with the result, as mentioned earlier, that by 2050 a quarter of the world’s population will be based in this region (Table 9).
| Table 9. Human population of the world (millions) | ||||||||||
| Region | 2000 | 2015 | 2020 | 2030 | 2050 | |||||
| Number | % | Number | % | Number | % | Number | % | Number | % | |
| Africa | 814.1 | 13.3 | 1186.2 | 16.1 | 1340.1 | 17.3 | 1679.3 | 19.8 | 2477.5 | 25.5 |
| Americas | 840.6 | 13.7 | 992.2 | 13.5 | 1037.8 | 13.4 | 1117.4 | 13.1 | 1217.4 | 12.5 |
| Asia | 3714.5 | 60.6 | 4393.3 | 59.8 | 4598.4 | 59.3 | 4922.8 | 57.9 | 5266.9 | 54.2 |
| Europe | 726.4 | 11.9 | 738.4 | 10.1 | 739.7 | 9.5 | 733.9 | 8.6 | 706.8 | 7.3 |
| Oceania | 31.1 | 0.5 | 39.3 | 0.5 | 42.1 | 0.5 | 47.4 | 0.6 | 56.6 | 0.6 |
| WORLD | 6126.6 | 100.0 | 7349.5 | 100.0 | 7758.2 | 100.0 | 8500.8 | 100.0 | 9725.2 | 100.0 |
| Source: FAO | ||||||||||
The figures on poultry meat consumption (Tables 10 and 11) are not direct measurements of uptake, but estimates of the quantities considered to be available for consumption.
As can be expected there are wide differences between the estimated poultry meat consumption figures around the world (Table 10), though all the major regions make contributions to the upward trend in the global average which rose by 3.5kg per person between 2000 and 2011. For Africa the gain over this period was 2kg per person (Tables 10, 11 and figure 3).
| Table 10. Poultry meat consumption (kg/person/year) | |||||||
|---|---|---|---|---|---|---|---|
| 2000 | 2005 | 2007 | 2008 | 2009 | 2010 | 2011 | |
| Africa | 4.2 | 4.7 | 5.2 | 5.4 | 5.6 | 6.1 | 6.2 |
| Americas | 31.5 | 34.1 | 36.0 | 37.1 | 35.9 | 37.6 | 38.5 |
| Asia | 6.6 | 7.4 | 8.1 | 8.5 | 9.0 | 9.2 | 9.5 |
| Europe | 15.9 | 19.2 | 20.2 | 21.3 | 21.7 | 21.4 | 21.7 |
| Oceania | 30.1 | 35.6 | 36.8 | 35.4 | 35.6 | 37.4 | 42.1 |
| WORLD | 11.0 | 12.2 | 13.1 | 13.6 | 13.8 | 14.1 | 14.5 |
| Source: FAO | |||||||
| Table 11. Human population of Africa and poultry meat consumption | ||||||||||
|---|---|---|---|---|---|---|---|---|---|---|
| Human population | Poultry meat consumption | |||||||||
| (millions) | (kg/person/year) | |||||||||
| Country | 2000 | 2015 | 2020 | 2030 | 2000 | 2007 | 2008 | 2009 | 2010 | 2011 |
| Algeria | 31.2 | 39.7 | 43.0 | 48.3 | 7.7 | 7.6 | 7.5 | 7.5 | 7.4 | 7.4 |
| Angola | 15.1 | 25.0 | 29.3 | 39.4 | 4.0 | 8.4 | 10.0 | 9.3 | 13.2 | 15.3 |
| Benin | 7.0 | 10.9 | 12.4 | 15.6 | 9.8 | 8.1 | 12.8 | 10.7 | 8.9 | 12.4 |
| Botswana | 1.8 | 2.3 | 2.5 | 2.8 | 5.4 | 3.6 | 4.9 | 4.6 | 5.4 | 5.2 |
| Burkina Faso | 11.6 | 18.1 | 20.9 | 27.2 | 2.3 | 2.3 | 2.3 | 2.4 | 2.4 | 2.4 |
| Burundi | 6.8 | 11.2 | 13.1 | 17.4 | - | - | - | - | - | - |
| Cabo Verde | 0.4 | 0.5 | 0.6 | 0.6 | 4.3 | 15.5 | 16.0 | 19.1 | 18.8 | 18.9 |
| Cameroon | 15.9 | 23.3 | 26.3 | 33.0 | 2.2 | 3.6 | 3.5 | 3.2 | 3.3 | 3.3 |
| Central African Rep | 3.7 | 4.9 | 5.4 | 6.5 | 0.9 | 1.2 | 1.3 | 1.3 | 1.4 | 1.4 |
| Chad | 8.3 | 14.0 | 16.4 | 22.0 | 0.6 | 0.5 | 0.5 | 0.5 | 0.5 | 0.4 |
| Comoros | 0.5 | 0.8 | 0.9 | 1.1 | - | - | - | - | - | - |
| Congo | 3.1 | 4.6 | 5.3 | 6.8 | 5.0 | 9.4 | 8.7 | 9.7 | 12.0 | 22.3 |
| Congo Dem Rep | 48.1 | 77.3 | 90.2 | 120.3 | - | - | - | - | - | - |
| Cote d'Ivoire | 16.5 | 22.7 | 25.6 | 32.1 | 1.5 | 1.3 | 1.3 | 1.3 | 1.9 | 1.8 |
| Djibouti | 0.7 | 0.9 | 1.0 | 1.1 | 0.6 | 7.2 | 7.7 | 5.3 | 1.6 | 0.8 |
| Egypt | 68.3 | 91.5 | 100.5 | 117.1 | 8.8 | 10.9 | 9.9 | 10.7 | 12.3 | 11.6 |
| Equatorial Guinea | 0.5 | 0.9 | 1.0 | 1.2 | - | - | - | - | - | - |
| Eritrea | 3.5 | 5.2 | 5.9 | 7.3 | - | - | - | - | - | - |
| Ethiopia | 66.4 | 99.4 | 112.0 | 138.3 | 0.6 | 0.6 | 0.6 | 0.6 | 0.7 | 0.6 |
| Gabon | 1.2 | 1.7 | 1.9 | 2.3 | 12.0 | 27.9 | 30.5 | 32.1 | 30.6 | 33.1 |
| Gambia | 1.2 | 2.0 | 2.3 | 3.1 | 2.2 | 4.9 | 2.3 | 3.5 | 3.2 | 4.3 |
| Ghana | 18.8 | 27.4 | 30.5 | 36.9 | 1.9 | 5.4 | 5.3 | 4.8 | 6.2 | 8.0 |
| Guinea | 8.8 | 12.6 | 14.4 | 18.3 | 0.6 | 1.1 | 1.2 | 1.1 | 1.4 | 1.6 |
| Guinea-Bissau | 1.3 | 1.8 | 2.1 | 2.5 | 1.3 | 1.6 | 1.7 | 1.8 | 1.9 | 2.1 |
| Kenya | 31.1 | 46.1 | 52.2 | 65.4 | 0.5 | 0.6 | 0.6 | 0.6 | 0.7 | 0.6 |
| Lesotho | 1.9 | 2.1 | 2.3 | 2.5 | 3.5 | 3.9 | 3.5 | 3.7 | 4.8 | 5.2 |
| Liberia | 2.9 | 4.5 | 5.1 | 6.4 | 3.2 | 4.5 | 4.9 | 4.5 | 5.7 | 7.9 |
| Libya | 5.3 | 6.3 | 6.7 | 7.4 | 19.2 | 19.9 | 19.9 | 19.3 | 19.7 | 20.1 |
| Madagascar | 15.7 | 24.2 | 27.8 | 36.0 | 4.1 | 3.6 | 3.5 | 3.5 | 3.4 | 3.4 |
| Malawi | 11.2 | 17.2 | 20.0 | 26.6 | 1.4 | 1.0 | 1.4 | 1.5 | 1.4 | 1.5 |
| Mali | 11.1 | 17.6 | 20.5 | 27.4 | 2.9 | 2.7 | 3.0 | 3.0 | 3.1 | 2.9 |
| Mauritania | 2.7 | 4.1 | 4.6 | 5.7 | 2.5 | 3.2 | 2.9 | 3.8 | 3.3 | 4.3 |
| Mauritius | 1.2 | 1.3 | 1.3 | 1.3 | 18.3 | 32.9 | 34.6 | 36.1 | 38.2 | 38.1 |
| Mayotte | 0.2 | 0.2 | 0.3 | 0.3 | - | - | - | - | - | - |
| Morocco | 29.0 | 34.4 | 36.4 | 39.8 | 9.4 | 13.8 | 15.8 | 17.5 | 19.5 | 20.2 |
| Mozambique | 18.3 | 28.0 | 32.0 | 41.4 | 2.0 | 1.5 | 1.6 | 1.9 | 1.7 | 1.8 |
| Namibia | 1.9 | 2.5 | 2.7 | 3.3 | 8.2 | 10.7 | 16.2 | 6.9 | 6.9 | 9.9 |
| Niger | 11.2 | 19.9 | 24.3 | 36.0 | 1.0 | 0.8 | 0.7 | 1.1 | 1.1 | 1.0 |
| Nigeria | 122.9 | 182.2 | 243.1 | 359.7 | 1.3 | 1.7 | 1.7 | 2.0 | 2.1 | 1.8 |
| Reunion | 0.7 | 0.9 | 0.9 | 1.0 | - | - | - | - | - | - |
| Rwanda | 8.0 | 11.6 | 13.0 | 15.8 | 0.2 | 0.2 | 0.2 | 0.2 | 0.2 | 0.2 |
| Saint Helena | # | # | # | # | - | - | - | - | - | - |
| Sao Tome/Principe | 0.1 | 0.2 | 0.2 | 0.3 | 4.3 | 8.1 | 9.0 | 8.5 | 10.9 | 10.6 |
| Senegal | 9.9 | 15.1 | 17.5 | 22.8 | 2.4 | 3.1 | 3.5 | 3.2 | 3.5 | 4.2 |
| Seychelles | 0.1 | 0.1 | 0.1 | 0.1 | - | - | - | - | - | - |
| Sierra Leone | 4.1 | 6.5 | 7.2 | 8.6 | 1.6 | 2.3 | 2.8 | 3.0 | 3.6 | 4.1 |
| Somalia | 7.4 | 10.8 | 12.4 | 16.5 | - | - | - | - | - | - |
| South Africa | 44.9 | 54.5 | 56.7 | 60.0 | 20.2 | 27.8 | 30.5 | 31.3 | 33.2 | 34.8 |
| South Sudan | - | 12.3 | 14.1 | 17.8 | - | - | - | - | - | - |
| Sudan | - | 40.2 | 45.3 | 56.4 | - | - | - | - | - | - |
| Sudan (former) | 34.4 | 45.6 | - | - | 0.8 | 0.7 | 0.7 | 0.7 | 0.9 | - |
| Swaziland | 1.1 | 1.3 | 1.4 | 1.5 | 3.8 | 5.6 | 5.1 | 5.0 | 5.2 | 5.3 |
| Tanzania Un Rep | 34.0 | 53.4 | 62.3 | 82.9 | 1.3 | 1.9 | 1.9 | 1.8 | 1.8 | 2.1 |
| Togo | 4.9 | 7.3 | 8.3 | 10.5 | 4.0 | 4.1 | 5.6 | 5.6 | 6.1 | 6.5 |
| Tunisia | 9.7 | 11.3 | 11.8 | 12.7 | 12.2 | 13.4 | 13.7 | 13.7 | 15.2 | 13.7 |
| Uganda | 23.8 | 39.0 | 45.9 | 61.9 | 1.8 | 1.4 | 1.4 | 1.6 | 1.8 | 1.8 |
| Western Sahara | 0.3 | 0.6 | 0.6 | 0.7 | - | - | - | - | - | - |
| Zambia | 10.6 | 16.2 | 18.9 | 25.3 | 3.5 | 3.0 | 3.1 | 3.1 | 3.3 | 3.2 |
| Zimbabwe | 12.5 | 15.6 | 17.5 | 21.4 | 2.0 | 4.5 | 4.8 | 6.1 | 6.1 | 6.7 |
| AFRICA | 814.1 | 1186.2 | 1340.1 | 1679.3 | 4.2 | 5.2 | 5.4 | 5.6 | 6.1 | 6.2 |
| Source: FAO | ||||||||||
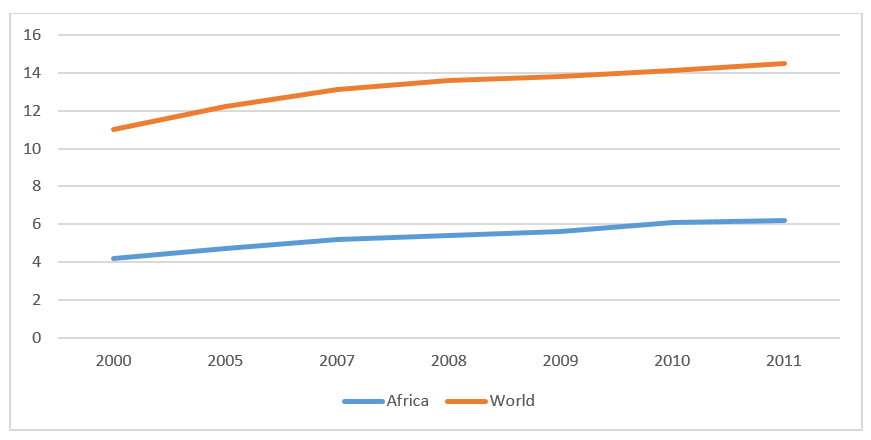
Figure 3. Africa's consumption growth has not matched the world average (kg/person/year)
While there are considerable differences between countries, in only a handful has the average uptake per person declined while, in contrast, many have recorded dramatic increases. Estimates of poultry consumption in South Africa vary according to source. USDA data indicates that uptake is around 36kg per person which compares with 3kg for mutton, 5kg for pork and 17 kg for beef.
On the other hand, SAPA quotes an average uptake figure of almost 38 kg per person for poultry and around 37.5kg for chicken. All reports show that chicken is the most affordable meat protein source, though high unemployment acts as a constraint on consumer spending.
Total domestic consumption of chicken in Angola is expected to reach 376,000 tonnes this as income growth is strengthening demand.