GLOBAL POULTRY TRENDS - Poultry Accounts for 40 Per Cent of World Meat Trade
This year, according to an FAO Food Outlook report, at just over 13 million tonnes the trade in poultry meat will grow and account for more than 40 per cent of the world trade in all meats (excluding intra-European Union sales), put at 31.2 million tonnes, writes industry analyst Terry Evans. 10 November 2015
 9 minute read
 By:
By: However, a USDA Global Analysis is less optimistic with regard to the world trade in broiler meat indicting that this might slip by 1 per cent to around 10.4 million tonnes, though it foresees exports from the EU (excluding intra-trade) rising by a percentage point or so to almost 1.2 million tonnes.
If trade between EU member States is included, then Europe is the second largest exporting region for fresh/frozen chicken accounting for over a quarter of the world total. Between 2000 and 2012 the volume of fresh/frozen chicken meat exported worldwide increased by 83 per cent rising from 6.9 million tonnes to 12.6 million tonnes (Table 5 and figure 3).
Europe’s share of this business has actually increased from 26 to 28 per cent as sales climbed from 1.8 million tonnes to almost 3.6 million tonnes.
| Table 5. World trade in fresh/frozen chicken meat ('000 tonnes) | |||||||
| Exports | 2000 | 2005 | 2008 | 2009 | 2010 | 2011 | 2012 |
|---|---|---|---|---|---|---|---|
| Africa | 9.5 | 4.8 | 9.5 | 46.3 | 61.5 | 14.4 | 14.3 |
| Americas | 3627.4 | 5517.2 | 7311.6 | 7235.3 | 7260.7 | 7539.5 | 7733.0 |
| Asia | 1432.2 | 420.6 | 765.8 | 876.5 | 1188.0 | 1373.1 | 1287.4 |
| Europe | 1805.1 | 2137.3 | 2344.7 | 2592.1 | 3115.7 | 3477.8 | 3547.9 |
| Oceania | 14.3 | 21.8 | 31.0 | 33.3 | 29.2 | 32.8 | 39.4 |
| WORLD | 6888.4 | 8101.7 | 10462.6 | 10783.5 | 11655.1 | 12437.6 | 12621.9 |
| Imports | |||||||
| Africa | 259.0 | 512.9 | 718.2 | 861.9 | 1069.0 | 1283.4 | 1550.4 |
| Americas | 556.0 | 912.2 | 1375.6 | 1384.4 | 1493.8 | 1505.2 | 1584.9 |
| Asia | 3276.7 | 2767.2 | 4274.9 | 4650.3 | 5021.5 | 5780.0 | 5328.6 |
| Europe | 1811.2 | 3223.6 | 3374.2 | 3095.0 | 2879.7 | 2790.3 | 3029.7 |
| Oceania | 26.4 | 35.5 | 38.1 | 44.0 | 48.8 | 59.2 | 66.4 |
| WORLD | 5929.3 | 7451.4 | 9781.0 | 10035.5 | 10512.8 | 11418.1 | 11560.1 |
| Source: FAO | |||||||
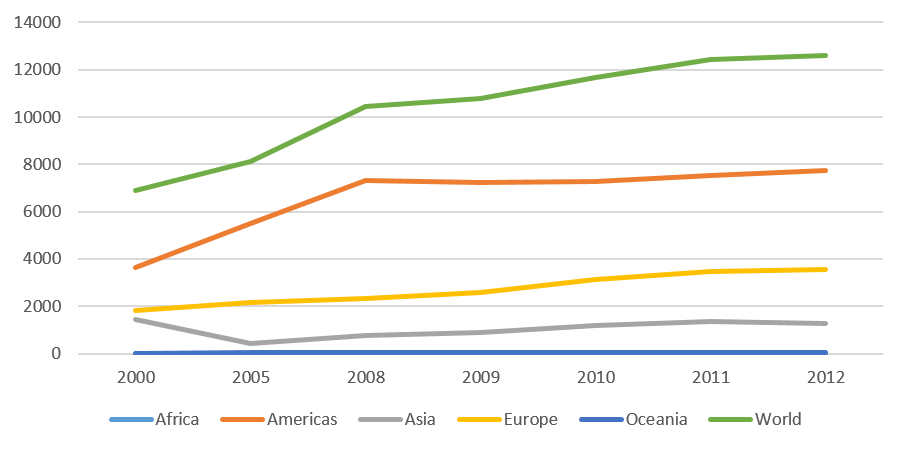
Figure 3. Europe expands its share of fresh/frozen chicken exports ('000 tonnes)
Back in 2000, 99 per cent of Europe’s exports came from European Union member countries. However, by 2012 this percentage had contracted to 94 per cent, primarily as a result of increases in exports from Belarus, the Ukraine and Lithuania.
In 2012 EU chicken exports amounted to 3.34 million tonnes. However, if sales to fellow EU countries are excluded then the amount sold to third countries totalled 1.02 million tonnes, which compares with 703,000 tonnes in 2000.
An EU Commission report on poultry meat considers that the Russian ban on imports from the EU (which has been extended until August 2016) is not having a significant impact on trade as the EU has been successful in diverting supplies to other countries in the Middle East and Africa, especially South Africa.
Growing demand from these and other markets are expected to boost EU third-country exports by more than 2 per cent per year to reach almost 1.6 million tonnes by 2024. However, the forecasts are subject to a level of uncertainty particularly with regard to the trade with South Africa where anti-dumping duties have been imposed on chicken exports from three member states – Germany, the Netherlands and the United Kingdom. It is hoped that these bans will be lifted this year.
Regardless of Russia’s ban on imports from the EU, her purchases were expected to decline anyway as a result of an increase in her level of self-sufficiency. In recent years the EU has put more emphasis on exporting lower quality and cheaper cuts such as legs and wings. However, the growth in total exports could slow should Brazil capture a bigger share of Asian and Middle East markets.
The Netherlands is the leading exporter in Europe shipping more than double the quantity of any other country. (Tables 6, 7 and figure 4). In 2012, more than 100 countries purchased a total of 916,000 tonnes of chicken meat from the Netherlands, some two-thirds being bought by Germany (205,000 tonnes) plus the United Kingdom (177,000 tonnes), followed by France (92,000 tonnes), Belgium (59,000 tonnes) and South Africa (57,000 tonnes).
| Table 6. Exports of fresh/frozen chicken meat from European countries (tonnes) | |||||||
| Country | 2000 | 2005 | 2008 | 2009 | 2010 | 2011 | 2012 |
|---|---|---|---|---|---|---|---|
| Albania | 2 | 0 | 5 | 0 | 0 | 0 | 0 |
| Austria | 4268 | 18318 | 25976 | 29400 | 30867 | 26376 | 30226 |
| Belarus | 6000 | 9914 | 5801 | 20457 | 37692 | 73605 | 103722 |
| Belgium | 268551 | 313233 | 316996 | 344015 | 385188 | 407928 | 442324 |
| Bosnia/Herzegovina | 30 | 17 | 579 | 1597 | 3763 | 4724 | 5258 |
| Bulgaria | 4988 | 7832 | 9379 | 23499 | 37861 | 39470 | 32873 |
| Croatia | 1340 | 2947 | 2690 | 2705 | 2764 | 3738 | 4074 |
| Czech Rep | 4536 | 21926 | 18121 | 19089 | 22194 | 21988 | 26650 |
| Denmark | 107403 | 102357 | 77152 | 83715 | 84915 | 72507 | 68437 |
| Estonia | 18307 | 2985 | 2950 | 3526 | 4664 | 7332 | 5383 |
| Finland | 1503 | 7662 | 9656 | 9375 | 8576 | 9422 | 10514 |
| France | 415059 | 355783 | 342688 | 348464 | 381245 | 426133 | 380317 |
| Germany | 97883 | 166775 | 206392 | 251493 | 269292 | 287543 | 321797 |
| Greece | 5485 | 7331 | 12345 | 11344 | 11754 | 16657 | 17550 |
| Hungary | 38380 | 32561 | 35391 | 35735 | 57841 | 81178 | 74082 |
| Iceland | 0 | 0 | 1 | 0 | 0 | 0 | 0 |
| Ireland | 17855 | 14225 | 16910 | 22291 | 38824 | 53406 | 44601 |
| Italy | 28874 | 62593 | 53514 | 55704 | 86232 | 86759 | 89990 |
| Latvia | 109 | 1224 | 3374 | 4373 | 6385 | 7285 | 8575 |
| Lithuania | 1009 | 10874 | 13801 | 16587 | 21273 | 27025 | 32608 |
| Luxembourg | 470 | 154 | 309 | 275 | 255 | 299 | 258 |
| Macedonia Rep | 93 | 134 | 57 | 49 | 10 | 79 | 273 |
| Malta | 1 | 1 | 8 | 0 | 0 | 41 | 104 |
| Moldova | 62 | 84 | 27 | 0 | 126 | 0 | 0 |
| Montenegro | - | - | 21 | 10 | 4 | 0 | 1 |
| Netherlands | 581063 | 624280 | 683728 | 731750 | 878132 | 995945 | 916250 |
| Norway | 41 | 70 | 24 | 60 | 4 | 25 | 52 |
| Poland | 30539 | 101737 | 153293 | 214688 | 285852 | 303732 | 380014 |
| Portugal | 1108 | 2018 | 3638 | 5158 | 7279 | 10329 | 11228 |
| Romania | 802 | 2573 | 8906 | 29767 | 54652 | 73182 | 76061 |
| Russian Federation | 2440 | 189 | 2395 | 3386 | 5293 | 1087 | 8944 |
| Serbia | - | - | 1566 | 1689 | 2130 | 2505 | 2731 |
| Slovakia | 1383 | 11944 | 15564 | 14666 | 26768 | 22972 | 30380 |
| Slovenia | 1322 | 7265 | 13592 | 12191 | 15170 | 15101 | 15642 |
| Spain | 48345 | 53753 | 72072 | 65163 | 95609 | 113769 | 89591 |
| Sweden | 4999 | 11168 | 9930 | 8765 | 10759 | 9956 | 10382 |
| Switzerland | 270 | 640 | 11 | 93 | 172 | 563 | 3186 |
| Ukraine | 810 | 101 | 7860 | 18881 | 26877 | 49711 | 80630 |
| United Kingdom | 109337 | 181462 | 217976 | 202140 | 215292 | 225420 | 223138 |
| EUROPEAN UNION | 1795202 | 2125049 | 2327313 | 2546836 | 3040948 | 3346512 | 3344216 |
| EU ex int | 703009 | 654330 | 666411 | 705951 | 893510 | 1013970 | 1020940 |
| EUROPE | 1805132 | 2137341 | 2344698 | 2592100 | 3115714 | 3477792 | 3547846 |
| Source: FAO, - no figure | |||||||
| Table 7. Leading chicken meat exporters in Europe ('000 tonnes) | |||||||
| Country | 2000 | 2005 | 2008 | 2009 | 2010 | 2011 | 2012 |
|---|---|---|---|---|---|---|---|
| Netherlands | 581.1 | 624.3 | 683.7 | 731.8 | 878.1 | 996.0 | 916.3 |
| Belgium | 268.6 | 313.2 | 317.0 | 344.0 | 385.2 | 407.9 | 442.3 |
| France | 415.1 | 355.8 | 342.7 | 348.5 | 381.3 | 426.1 | 380.3 |
| Poland | 30.5 | 101.7 | 153.3 | 214.7 | 285.9 | 303.7 | 380.0 |
| Germany | 97.9 | 166.8 | 206.4 | 251.5 | 269.3 | 287.5 | 321.8 |
| United Kingdom | 109.3 | 181.5 | 218.0 | 202.1 | 215.3 | 225.4 | 223.1 |
| Source: FAO | |||||||
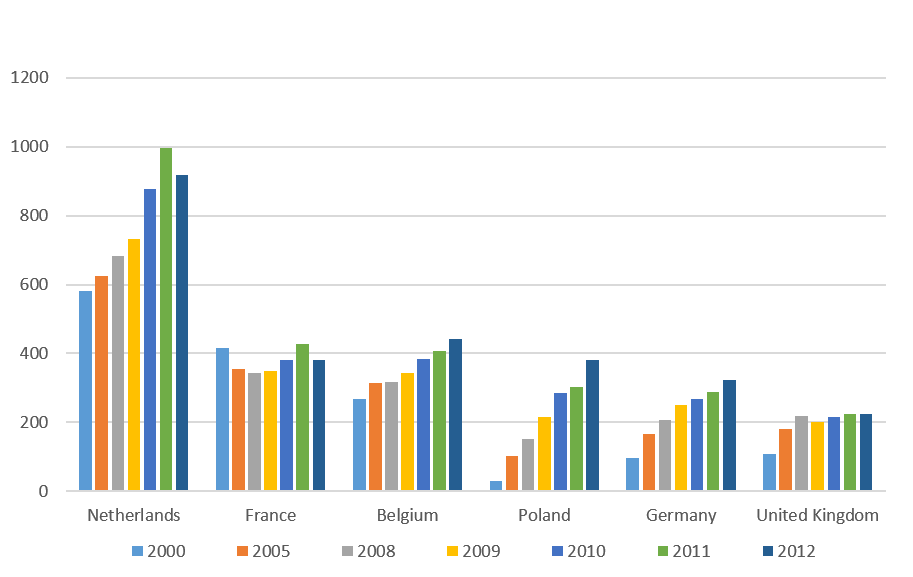
Figure 4. Europe's leading exporters of fresh/frozen chicken meat ('000 tonnes)
In recent years Belgium’s exports have grown annually, but sales from France and the UK have stagnated.
Most remarkable has been the increases recorded by Germany and Poland, particularly the latter where, from a low base of only 31,000 tonnes in 2000, trade expanded to overtake Germany in 2010 a situation which has persisted.
Poland’s main markets in 2012 were the Czech Republic (43,000 tonnes), the UK (40,000 tonnes), Germany (34,000 tonnes), the Netherlands (33,000 tonnes), Slovakia (31,000 tonnes) and Bulgaria (25,000 tonnes). Germany’s biggest customers were the Netherlands (65,000 tonnes), France (35,000 tonnes), the UK (26,000 tonnes), South Africa (21,000 tonnes) and Italy (21,000 tonnes).
There are several reasons why the global totals for exports and imports of chicken do not balance (Table 5) and these were explained in the regional report on Asia presented earlier this year.
Europe takes second place behind Asia with regard to chicken meat imports (Table 5), taking more than 3 million tonnes in 2012, which was 24 per cent of the total exported of 12.6 million tonnes.
Of the 3 million tonnes, 2.3 million tonnes or 75 per cent, were purchased by EU countries, some 94 per cent of which came from fellow members. Based on the FAO data (Table 9 and figure 5) the Russian Federation was the biggest importer in the region up to 2012.
| Table 9. Leading importers of fresh/frozen chicken in Europe ('000 tonnes) | |||||||
| Country | 2000 | 2005 | 2008 | 2009 | 2010 | 2011 | 2012 |
|---|---|---|---|---|---|---|---|
| Russian Federation | 580.1 | 1204.0 | 1139.1 | 912.0 | 602.9 | 384.2 | 497.8 |
| United Kingdom | 259.1 | 352.6 | 296.5 | 304.3 | 342.4 | 371.6 | 355.7 |
| Netherlands | 111.3 | 271.2 | 408.0 | 309.6 | 308.2 | 355.3 | 340.5 |
| Germany | 195.4 | 221.0 | 216.0 | 261.8 | 299.1 | 320.6 | 329.1 |
| France | 124.3 | 180.6 | 230.2 | 256.1 | 292.5 | 317.5 | 317.4 |
| Belgium | 60.2 | 84.0 | 97.7 | 95.9 | 105.2 | 132.2 | 150.1 |
| Source: FAO | |||||||
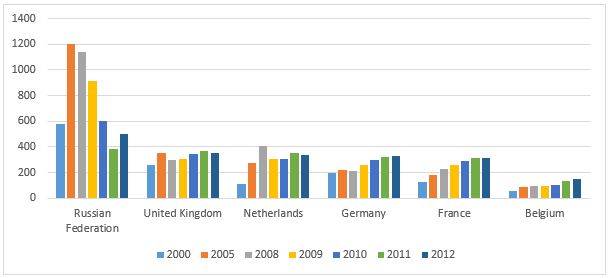
Figure 5. Increased imports in some countries have not offset the decline in Russia ('000 tonnes)
Brazil and Belarus accounted for nearly 30 per cent of Russia’s imports in 2013. More recent figures provided by the USDA indicate that Russia’s broiler meat imports have continued to decline to a new low of 320,000 tonnes for this year (Figure 6) with, over the first five months of 2015, Belarus and Brazil accounting for 89 per cent.
The likelihood is that her imports will continue to decline as Russia increases its level of self-sufficiency in chicken meat and the latest forecast for 2016 points to an annual figure of only 100,000 tonnes.
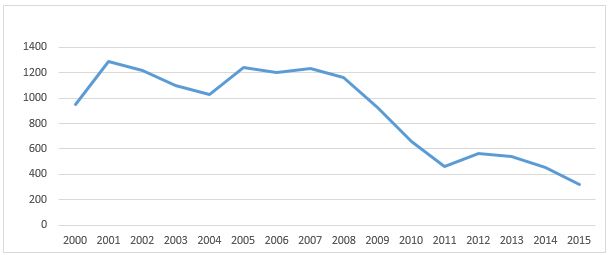
Figure 6. How Russia's broiler meat imports have fallen ('000 tonnes)
While the commentary so far has been restricted to the trade in fresh/frozen chicken meat, there is a large market in prepared/processed chicken meat (Table 10). Broadly speaking this trade has increased fourfold since 2000 amounting to around two million tonnes in 2012.
The latter is equivalent to nearly 3 million tonnes eviscerated weight bringing the total exports of all forms of chicken up to around 15.5 million tonnes on an eviscerated weight basis. It should be noted that the FAO’s Food Outlook report on the trade in poultry meat as well as the USDA’s figures on the world in broiler meat, exclude the trade between EU countries.
| Table 10. World trade in prepared/processed chicken meat ('000 tonnes) | |||||||
| Exports | 2000 | 2005 | 2008 | 2009 | 2010 | 2011 | 2012 |
|---|---|---|---|---|---|---|---|
| Africa | 1.8 | 2.1 | 1.4 | 1.0 | 1.0 | 0.7 | 3.0 |
| Americas | 92.9 | 270.2 | 427.1 | 418.5 | 427.6 | 424.8 | 430.0 |
| Asia | 212.4 | 515.8 | 599.3 | 603.4 | 699.5 | 811.7 | 828.4 |
| Europe | 260.8 | 432.7 | 635.0 | 680.3 | 694.8 | 746.3 | 787.5 |
| Oceania | 2.2 | 1.8 | 1.0 | 1.8 | 2.9 | 3.4 | 5.2 |
| WORLD | 570.1 | 1222.6 | 1663.8 | 1704.9 | 1825.9 | 1986.9 | 2054.0 |
| Imports | |||||||
| Africa | 1.9 | 7.0 | 8.9 | 7.3 | 7.7 | 10.7 | 14.5 |
| Americas | 67.8 | 90.8 | 127.8 | 122.6 | 138.7 | 149.0 | 160.6 |
| Asia | 186.7 | 389.6 | 412.6 | 429.9 | 538.2 | 648.9 | 637.5 |
| Europe | 304.3 | 677.6 | 932.2 | 948.0 | 1009.2 | 1075.0 | 1139.0 |
| Oceania | 1.3 | 2.0 | 4.1 | 5.5 | 8.9 | 10.0 | 13.2 |
| WORLD | 561.9 | 1167.0 | 1485.6 | 1513.2 | 1701.0 | 1893.7 | 1964.6 |
| European processed chicken exports ('000 tonnes) | |||||||
| European Union | 258.9 | 410.2 | 628.4 | 676.5 | 691.3 | 743.0 | 782.8 |
| EU ex int | 31.2 | 32.3 | 43.3 | 44.6 | 44.9 | 48.4 | 49.8 |
| EUROPE | 260.8 | 432.7 | 635 | 680.3 | 694.8 | 746.3 | 787.5 |
| European processed chicken imports ('000 tonnes) | |||||||
| European Union | 290.7 | 629.6 | 897.4 | 918.4 | 978.8 | 1044.1 | 1106.6 |
| EU ex int | 85.6 | 301.8 | 419.1 | 429.7 | 428.7 | 441.3 | 442.4 |
| EUROPE | 304 | 677.6 | 932.2 | 948.0 | 1009.2 | 1075.0 | 1139.0 |
| Source: FAO | |||||||
Europe plays an important role in this business accounting for 1.14 million tonnes of imports in 2012 which represented more than half of global exports, while her exports at 788,000 tonnes equated with some 38 per cent of global imports.
Virtually all the imports went to EU countries. In 2012 Germany purchased 234,000 tonnes of which 61,000 tonnes were supplied by Brazil, Portugal 42,000 tonnes, the Netherlands (40,000 tonnes) and Thailand (21,000 tonnes).
The second biggest buyer was the Netherlands taking almost 210,000 tonnes. Here, Brazil was the leading supplier with 106,000 tonnes, followed by Thailand with 34,000 tonnes, Belgium with 24,000 tonnes and Germany with 20,000 tonnes.
On the export front, of the 788,000 tonnes of prepared/processed chicken meat exported by European countries 187,000 tonnes were sold by Germany, with the Netherlands the second largest operator with 163,000 tonnes.
The Netherlands was Germany’s biggest customer taking 39,000 tonnes followed by France (27,000 tonnes), the UK (22,000 tonnes), and Italy (13,000 tonnes). The Netherlands shipped some 52,000 tonnes of prepared/processed products to Germany, 31,000 tonnes to the UK and 23,000 tonnes to Belgium.
November 2015