

GLOBAL POULTRY TRENDS: Upward Trend in Chicken Meat Consumption in Africa, Oceania
Protein uptake is set to climb more rapidly in Africa, while Australians are eating ever more chicken, according to industry analyst, Terry Evans, in the final part of his review of the chicken industries in Africa and Oceania.African Protein Uptake to Climb Rapidly
Consumption of animal protein in Africa is projected to climb rapidly by the Food and Agriculture Organisation (FAO) with meat uptake anticipated to expand by 2.8 per cent per year between 2005/7 and 2030.However, there is concern that domestic producers will not be able to meet this growing demand, hence Africa is likely to become increasingly a net importer of livestock products.
Between 2000 and 2030, the human population of Africa is expected to increase by some 2.4 per cent per year compared with a worldwide average of little more than one per cent. So, by 2030 Africa’s share of the global total will approach 20 per cent as compared with a little over 13 per cent in 2000 (Table 1).
| Table 1. Human population of the world (millions) | ||||||||
| Region | 2000 | 2010 | 2020 | 2030 | ||||
|---|---|---|---|---|---|---|---|---|
| Number | % | Number | % | Number | % | Number | % | |
| Africa | 808.3 | 13.2 | 1,031.1 | 14.9 | 1,312.1 | 17.0 | 1,634.4 | 19.4 |
| Americas | 841.7 | 13.7 | 942.7 | 13.6 | 1,037.5 | 13.4 | 1,120.1 | 13.3 |
| Asia | 3,717.4 | 60.7 | 4,165.4 | 60.2 | 4,581.5 | 59.4 | 4,886.9 | 58.0 |
| Europe | 729.1 | 11.9 | 740.3 | 10.7 | 743.6 | 9.6 | 736.4 | 8.7 |
| Oceania | 31.2 | 0.5 | 36.7 | 0.5 | 42.1 | 0.6 | 47.3 | 0.6 |
| WORLD | 6,127.7 | 100.0 | 6,916.2 | 100.0 | 7,716.7 | 100.0 | 8,424.9 | 100.0 |
| Source: FAO | ||||||||
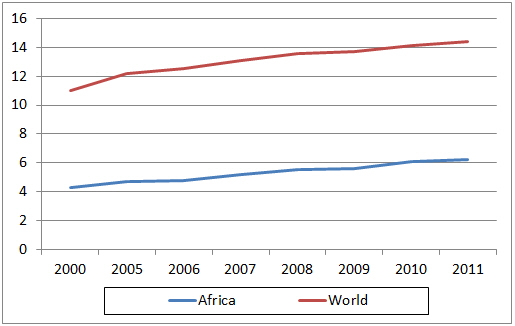
On a global basis, poultry meat consumption per person rose by 3.4kg or 31 per cent between 2000 and 2011, from 11.0kg to 14.4kg (Table 2 and Figure 1).
| Table 2. Poultry meat consumption (kg per person and year) | |||||||
| Region | 2000 | 2005 | 2007 | 2008 | 2009 | 2010 | 2011 |
|---|---|---|---|---|---|---|---|
| Africa | 4.3 | 4.7 | 5.2 | 5.5 | 5.6 | 6.1 | 6.2 |
| Americas | 31.5 | 34.1 | 36.0 | 37.1 | 35.9 | 37.6 | 38.6 |
| Asia | 6.6 | 7.4 | 8.1 | 8.5 | 9.0 | 9.2 | 9.4 |
| Europe | 15.9 | 19.2 | 20.2 | 21.3 | 21.7 | 21.4 | 21.7 |
| EU | 19.6 | 21.0 | 20.6 | 21.5 | 21.9 | 21.4 | 21.7 |
| Oceania | 30.1 | 35.6 | 36.8 | 35.4 | 35.6 | 37.4 | 42.1 |
| WORLD | 11.0 | 12.2 | 13.1 | 13.6 | 13.7 | 14.1 | 14.4 |
| Source: FAO | |||||||
The individual country data (Table 3) reveal wide differences, though it must be appreciated that these figures are estimates of the supplies available to be eaten and are not a direct measurement of actual consumption.
| Table 3. Human population of Africa and poultry meat consumption | ||||||||||
| Human population (millions) | Poultry meat consumption (kg/person/year) | |||||||||
|---|---|---|---|---|---|---|---|---|---|---|
| Country | 2000 | 2010 | 2020 | 2030 | 2000 | 2007 | 2008 | 2009 | 2010 | 2011 |
| Algeria | 31.7 | 37.1 | 43.8 | 48.6 | 7.7 | 7.6 | 7.5 | 7.5 | 7.5 | 7.4 |
| Angola | 13.9 | 19.6 | 26.5 | 34.8 | 4.0 | 8.4 | 10.0 | 9.3 | 13.2 | 15.3 |
| Benin | 7.0 | 9.5 | 12.3 | 15.5 | 9.8 | 8.1 | 12.8 | 10.7 | 8.9 | 12.4 |
| Botswana | 1.8 | 2.0 | 2.2 | 2.4 | 5.4 | 3.6 | 4.9 | 4.6 | 5.4 | 5.2 |
| Burkina Faso | 11.6 | 15.5 | 20.5 | 26.6 | 2.3 | 2.3 | 2.3 | 2.4 | 2.4 | 2.4 |
| Burundi | 6.7 | 9.2 | 12.6 | 16.4 | - | - | - | - | - | - |
| Cameroon | 15.9 | 20.6 | 26.4 | 33.1 | 2.2 | 3.6 | 3.5 | 3.2 | 3.3 | 3.3 |
| Cabo Verde | 0.4 | 0.5 | 0.5 | 0.6 | 4.3 | 15.5 | 16.0 | 19.1 | 18.8 | 18.9 |
| Central African Rep. | 3.6 | 4.4 | 5.3 | 6.3 | 0.9 | 1.2 | 1.3 | 1.3 | 1.4 | 1.4 |
| Chad | 8.3 | 11.7 | 15.7 | 20.9 | 0.6 | 0.5 | 0.5 | 0.5 | 0.5 | 0.4 |
| Comoros | 0.5 | 0.7 | 0.9 | 1.1 | - | - | - | - | - | - |
| Congo | 3.1 | 4.1 | 5.3 | 6.8 | 5 | 9.4 | 8.7 | 9.7 | 12.0 | 22.3 |
| Congo Dem. Rep. | 47.0 | 62.2 | 81.3 | 103.7 | - | - | - | - | - | - |
| Cote d'Ivoire | 16.1 | 19.0 | 23.8 | 29.2 | 1.5 | 1.3 | 1.3 | 1.3 | 1.9 | 1.8 |
| Djibouti | 0.7 | 0.8 | 1.0 | 1.1 | 0.6 | 7.2 | 7.7 | 5.3 | 1.6 | 0.8 |
| Egypt | 66.1 | 78.1 | 91.1 | 102.6 | 8.8 | 10.9 | 9.9 | 10.7 | 12.3 | 11.6 |
| Equatorial Guinea | 0.5 | 0.7 | 0.9 | 1.1 | - | - | - | - | - | - |
| Eritrea | 3.9 | 5.7 | 7.7 | 9.8 | - | - | - | - | - | - |
| Ethiopia | 66.0 | 87.1 | 111.5 | 137.7 | 0.6 | 0.6 | 0.6 | 0.6 | 0.7 | 0.6 |
| Gabon | 1.2 | 1.6 | 2.0 | 2.4 | 12.0 | 27.9 | 30.5 | 32.1 | 30.6 | 33.1 |
| Gambia | 1.2 | 1.7 | 2.3 | 3.1 | 2.2 | 4.9 | 2.3 | 3.5 | 3.2 | 4.3 |
| Ghana | 18.8 | 24.3 | 29.8 | 35.3 | 1.9 | 5.4 | 5.3 | 4.8 | 6.2 | 8.0 |
| Guinea | 8.8 | 10.9 | 13.9 | 17.3 | 0.6 | 1.1 | 1.2 | 1.1 | 1.4 | 1.6 |
| Guinea-Bissau | 1.3 | 1.6 | 2.0 | 2.5 | 1.3 | 1.6 | 1.7 | 1.8 | 1.9 | 2.1 |
| Kenya | 31.3 | 40.9 | 52.9 | 66.3 | 0.5 | 0.6 | 0.6 | 0.6 | 0.7 | 0.5 |
| Lesotho | 1.9 | 2.0 | 2.2 | 2.4 | 3.5 | 3.9 | 3.5 | 3.7 | 4.8 | 5.2 |
| Liberia | 2.9 | 4.0 | 5.1 | 6.4 | 3.2 | 4.5 | 4.9 | 4.5 | 5.7 | 7.9 |
| Libya | 5.2 | 6.0 | 6.8 | 7.5 | 19.2 | 19.9 | 19.9 | 19.3 | 19.7 | 20.1 |
| Madagascar | 15.8 | 21.1 | 27.8 | 36.0 | 4.1 | 3.6 | 3.5 | 3.5 | 3.4 | 3.4 |
| Malawi | 11.3 | 15.0 | 19.9 | 26.0 | 1.4 | 1.0 | 1.4 | 1.5 | 1.4 | 1.5 |
| Mali | 10.3 | 14.0 | 19.1 | 26.0 | 2.9 | 2.7 | 3.0 | 3.0 | 3.1 | 2.9 |
| Mauritania | 2.7 | 3.6 | 4.6 | 5.6 | 2.5 | 3.2 | 2.9 | 3.8 | 3.3 | 4.3 |
| Mauritius | 1.2 | 1.2 | 1.3 | 1.3 | 18.3 | 32.9 | 34.6 | 36.1 | 38.2 | 38.1 |
| Mayotte | 0.2 | 0.2 | 0.2 | 0.3 | - | - | - | - | - | - |
| Morocco | 28.7 | 31.6 | 35.9 | 39.2 | 9.4 | 13.8 | 15.8 | 17.5 | 19.5 | 20.2 |
| Mozambique | 18.3 | 24.0 | 30.6 | 38.9 | 2.0 | 1.5 | 1.6 | 1.9 | 1.7 | 1.8 |
| Namibia | 1.9 | 2.2 | 2.6 | 3.0 | 8.2 | 10.7 | 16.2 | 6.9 | 6.9 | 9.9 |
| Niger | 11.0 | 15.9 | 23.4 | 34.5 | 1.0 | 0.8 | 0.7 | 1.1 | 1.1 | 1.0 |
| Nigeria | 122.9 | 159.7 | 210.2 | 273.1 | 1.3 | 1.7 | 1.7 | 2.0 | 2.1 | 1.8 |
| Reunion | 0.7 | 0.9 | 0.9 | 1.0 | - | - | - | - | - | - |
| Rwanda | 8.4 | 10.8 | 14.1 | 17.8 | 0.2 | 0.2 | 0.2 | 0.2 | 0.2 | 0.2 |
| Saint Helena | # | # | # | # | - | - | - | - | - | - |
| Sao Tome/Principe | 0.1 | 0.2 | 0.2 | 0.3 | 4.3 | 8.1 | 9.0 | 8.5 | 10.9 | 10.6 |
| Senegal | 9.9 | 13.0 | 17.1 | 21.9 | 2.4 | 3.1 | 3.5 | 3.2 | 3.5 | 4.2 |
| Seychelles | 0.1 | 0.1 | 0.1 | 0.1 | - | - | - | - | - | - |
| Sierra Leone | 4.1 | 5.8 | 6.9 | 8.1 | 1.6 | 2.3 | 2.8 | 3.0 | 3.6 | 4.1 |
| Somalia | 7.4 | 9.6 | 12.8 | 16.9 | - | - | - | - | - | - |
| South Africa | 44.9 | 51.5 | 55.1 | 58.1 | 20.2 | 27.8 | 30.5 | 31.3 | 33.2 | 34.8 |
| South Sudan | - | - | 13.9 | 17.3 | - | - | - | - | - | - |
| Sudan | - | - | 44.5 | 55.1 | - | - | - | - | - | - |
| Sudan (former) | 34.4 | 45.6 | - | - | 0.8 | 0.7 | 0.7 | 0.7 | 0.9 | 1.0 |
| Swaziland | 1.1 | 1.2 | 1.4 | 1.5 | 3.8 | 5.6 | 5.1 | 5.0 | 5.2 | 5.3 |
| Tanzania United Rep. | 34.0 | 45.0 | 60.4 | 79.4 | 1.3 | 1.4 | 1.3 | 1.3 | 1.3 | 1.2 |
| Togo | 4.9 | 6.3 | 8.1 | 10.0 | 4.0 | 4.1 | 5.6 | 5.6 | 6.1 | 6.5 |
| Tunisia | 9.6 | 10.6 | 11.8 | 12.6 | 12.2 | 13.4 | 13.7 | 13.7 | 15.2 | 13.7 |
| Uganda | 24.3 | 34.0 | 47.1 | 63.4 | 1.8 | 1.4 | 1.4 | 1.6 | 1.8 | 1.8 |
| Western Sahara | 0.3 | 0.5 | 0.7 | 0.8 | - | - | - | - | - | - |
| Zambia | 10.1 | 13.2 | 18.3 | 25.0 | 3.5 | 3.0 | 3.1 | 3.1 | 3.3 | 3.2 |
| Zimbabwe | 12.5 | 13.1 | 17.1 | 20.3 | 2.0 | 4.5 | 4.8 | 6.1 | 6.1 | 6.7 |
| AFRICA | 808.3 | 1,031.1 | 1,312.1 | 1,634.4 | 4.3 | 5.2 | 5.5 | 5.6 | 6.1 | 6.2 |
| - no figure Source: FAO |
||||||||||
One-third of the countries for which the FAO has been able to calculate theoretical consumption of poultry meat recorded an average of less than 2kg per person in 2011. At the other end of the scale, an almost equal number returned a figure of 8kg or more per person, while amongst this latter group, five countries averaged more than 20kg per person.
That chicken continues to be a more affordable protein source compared with other meats is a key factor in expanding uptake along with, of course, improvements in wealth being spread throughout communities.
In South Africa in 2013 the only protein source more affordable than broiler meat was eggs. According to the South African Poultry Association (SAPA), poultry meat consumption came close to 35.7kg in 2013. However, currently, the level of unemployment and consumer spending power remain causes for concern and are affecting food purchases.

Australians to Eat Even More Chicken
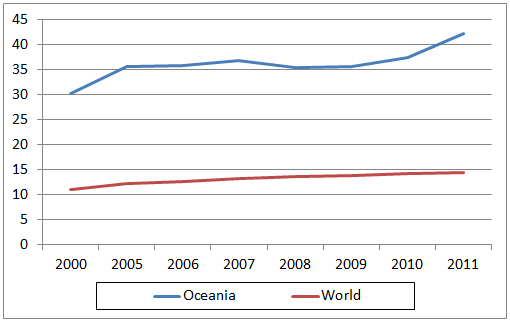
Australia currently accounts for 60 per cent of the human population of Oceania and, with average poultry meat consumption in 2011 of 45kg per person, clearly this country has a major impact on the average uptake for the region of 42.1kg (Table 4 and Figure 2).
| Table 4. Human population of Oceania and poultry meat consumption | |||||||||||
| Human population (millions) | Poultry meat consumption (kg/person/year) | ||||||||||
|---|---|---|---|---|---|---|---|---|---|---|---|
| Country | 2000 | 2010 | 2015 | 2020 | 2000 | 2007 | 2008 | 2009 | 2010 | 2011 | |
| American Samoa | 0.1 | 0.1 | 0.1 | 0.1 | - | - | - | - | - | - | |
| Australia | 19.3 | 22.4 | 25.4 | 28.3 | 32.4 | 39.0 | 37.3 | 38.2 | 40.1 | 45.1 | |
| Cook Isl. | # | # | # | # | - | - | - | - | - | - | |
| Fiji | 0.8 | 0.9 | 0.9 | 0.9 | 12.4 | 18.7 | 18.6 | 15.0 | 18.7 | 24.6 | |
| French Polynesia | 0.2 | 0.3 | 0.3 | 0.3 | 40.1 | 46.8 | 45.6 | 46.0 | 45.8 | 48.5 | |
| Guam | 0.2 | 0.2 | 0.2 | 0.2 | - | - | - | - | - | - | |
| Kiribati | 0.1 | 0.1 | 0.1 | 0.1 | 13.2 | 21.6 | 17.8 | 16.4 | 14.9 | 15.6 | |
| Marshall Isl. | 0.1 | 0.1 | 0.1 | 0.1 | - | - | - | - | - | - | |
| Micronesia Fed. States | 0.1 | 0.1 | 0.1 | 0.1 | - | - | - | - | - | - | |
| Nauru | # | # | # | # | - | - | - | - | - | - | |
| New Caledonia | 0.2 | 0.3 | 0.3 | 0.3 | 31.7 | 42.2 | 41.1 | 43.5 | 40.7 | 43.7 | |
| New Zealand | 3.9 | 4.4 | 4.8 | 5.2 | 26.7 | 34.4 | 33.5 | 30.7 | 32.2 | 35.5 | |
| Niue | # | # | # | # | - | - | - | - | - | - | |
| North Mariana Isl. | 0.1 | 0.1 | 0.1 | 0.1 | - | - | - | - | - | - | |
| Palau | # | # | # | # | - | - | - | - | - | - | |
| Papua New Guinea | 5.4 | 6.9 | 8.4 | 10.0 | - | - | - | - | - | - | |
| Samoa | 0.2 | 0.2 | 0.2 | 0.2 | 24.5 | 34.4 | 40.4 | 41.5 | 52.3 | 58.1 | |
| Solomon Isl. | 0.4 | 0.5 | 0.6 | 0.8 | 0.8 | 1.6 | 2.0 | 2.3 | 2.4 | 6.0 | |
| Tokelau | # | # | # | # | - | - | - | - | - | - | |
| Tonga | 0.1 | 0.1 | 0.1 | 0.1 | - | - | - | - | - | - | |
| Tuvalu | # | # | # | # | - | - | - | - | - | - | |
| Vanuatu | 0.2 | 0.2 | 0.3 | 0.4 | 6.7 | 8.3 | 10.6 | 10.6 | 11.4 | 12.2 | |
| Wallis/Futuna Isl. | # | # | # | # | - | - | - | - | - | - | |
| OCEANIA | 31.2 | 36.7 | 42.1 | 47.3 | 30.1 | 36.8 | 35.4 | 35.6 | 37.4 | 42.1 | |
| # less than 50,000; - no figure Source: FAO |
|||||||||||
According to ABARES, chicken meat consumption in Australia averaged 44kg per person in 2011/12, is expected to rise by one per cent in 2013/14 to 44.7kg and a further one per cent in 2015/16 to 45.2kg. Over the medium term, uptake is projected to reach 47.7kg per person by 2018/19.
This growth primarily reflects the competitive pricing of chicken relative to other meats, a situation which is expected to persist for the foreseeable future.
Other factors favouring increased chicken consumption are greater diversity in the range of chicken products, improved quality and consistency and better targeted and more strongly focused marketing, says the Australian Chicken Meat Federation.

December 2014


