Greater Bioavailability of Chelates Found When Compared to Inorganic Zinc in Broiler Chicks
A new study compared the bioavailability of different forms of zinc when fed to broilers with the objective of developing more effective and efficient poultry nutrition options for producers. 8 September 2015
 43 minute read
 By:
By: Abstract
Animal diets often contain antagonists that reduce Zn bioavailability, thereby creating a deficiency.
The bioavailability of Zn chelated to 2-hydroxy-4-(methylthio)butanoic acid (chelated Zn) was compared with Zn sulfate in broiler chicks in two dietary conditions: a Zn-deficient corn-soybean meal (C-SBM) diet and a Zn-deficient C-SBM diet containing elevated Ca and P as antagonists.
In experiment 1, chicks were fed a common diet (19 mg Zn/kg diet) through day 8, and then a Zn-unsupplemented (21 mg Zn/kg diet; 0.82 per cent Ca, 0.47 per cent available P) C-SBM basal or the basal supplemented with 5, 10, 15, 20, or 30 mg Zn/kg diet as chelated Zn or Zn sulfate for 6 days.
Common-intercept, multiple linear regression slope-ratio analysis indicated significantly greater Zn bioavailability for chelated Zn relative to Zn sulfate as judged by: total tibia Zn (μg) (161 per cent; P=0.001); tibia zinc concentration (μg/g; 165 per cent, P=0.0009); and small intestinal metallothionein mRNA expression (248 per cent; P=0.009).
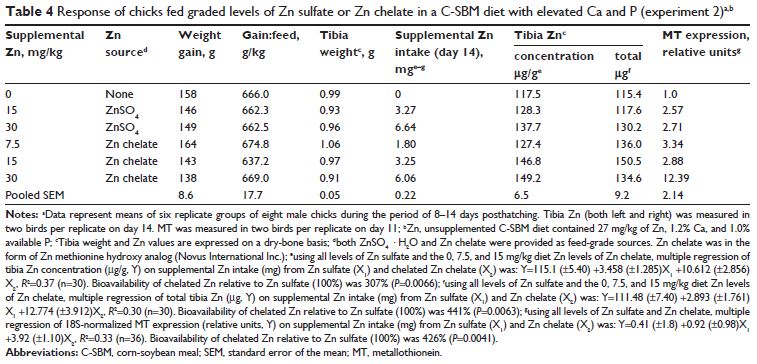
In experiment 2, chicks were fed a Zn-deficient (24 mg Zn/kg diet) common diet, then fed a C-SBM basal elevated in Ca and P (27 mg Zn/kg diet; 1.2 per cent Ca, 1 per cent available P), or the basal supplemented with 15 or 30 mg Zn/kg diet as Zn sulfate or 7.5, 15, or 30 mg Zn/kg diet as chelated Zn. Zn sulfate was antagonized to a greater extent than Zn chelate.
Bioavailability of chelated Zn relative to Zn sulfate was 441 per cent (P=0.0063; μg total tibia Zn), 307 per cent (P=0.0066; μg/g tibia Zn), and 426 per cent (P=0.0041; metallothionein).
Thus, feeding chelated Zn offers advantages over inorganic Zn, especially in diets containing high levels of Ca and P, which is a common occurrence in pet food and in livestock diets.
Introduction
Zinc impacts a wide variety of functions, including gene expression, DNA and protein synthesis, cell signaling, cell division and animal growth, immune development and function, synthesis of structural proteins such as collagen and keratin, bone and tissue development, reproduction, and defence against oxidative stress (1-11).
Deficiency or marginal Zn status can negatively impact one or more of these processes. As such, Zn is supplemented in virtually all animal diets, either as inorganic trace mineral (ITM) salts (such as sulfates, chlorides, and oxides), and/or organic trace minerals (OTMs).
While ITMs are inexpensive, it is generally accepted that they suffer from relatively poor bioavailability compared when with some OTMs, primarily due to the numerous antagonisms and interactions between the ITMs and other components of the digesta, such as phytic acid and fiber (10,12,13).
Other types of Zn antagonisms have been reported, including excesses of Ca and/or P.10,14–16 The antagonistic effect of excess Ca on Zn utilisation is widely known, especially in the presence of phytate (17). Few studies, however, have evaluated the effects of P excess on Zn bioavailability, and the results of these studies have been inconsistent (18).
Studies demonstrating detrimental effects of excess P concluded that both Ca and P excess antagonized Zn independently of each other, but that the combination of Ca and P were additive (14,15,19).
In addition, Zn antagonism occurred under both balanced and unequal Ca:P ratios. According to Heth et al, Ca decreased Zn absorption in the presence of 1 per cent dietary P, but not when P was 0.3 per cent–0.5 per cent (15).
Furthermore, detrimental effects of P occurred for both phytic acid P and inorganic P, and either form of inorganic P (eg, polyphosphates or orthophosphates) was antagonistic. Other studies, however, failed to show negative effects of P excess on Zn utilization (20–22).
However, these latter studies suffered from insufficient statistical power, response variables with limited sensitivity to Zn deficiency, or utilized diets not deficient in Zn, thus having a limited likelihood of observing any effect.
It is widely accepted that a higher degree of nutrition is required to achieve the full genetic and economic potential of today’s livestock. Balancing both macrominerals and microminerals is a key component of optimising nutritional health, whether it is the health of livestock, pets, or humans.
Feeding higher levels of trace minerals is not a viable solution because this can lead to lower mineral bioavailability, increase environmental burden, and potentially even decrease animal performance. A more sustainable solution is to feed a more bioavailable source of trace minerals such as OTM. However, the literature indicates that not all OTMs are more available than the ITM salts (23–26).
Bioavailability can be defined as “the degree to which an ingested nutrient in a particular source is absorbed in a form that can be utilised in metabolism by the animal” (27). In practice, relative bioavailability value (RBV), or the bioavailability of a nutrient within one source relative to the bioavailability of the same nutrient in a standard source, is measured.
Measuring the deposition or storage of minerals into selected tissues is the most common variable measured in trace mineral RBV experiments; for example, tibia Zn is commonly cited for most Zn RBV studies (23,24,26,28–31). In addition, it has been reported that the expression levels of several genes and proteins increase or decrease rapidly depending on the Zn status of the animal (1).
Metallothionein (MT) mRNA and protein are both modulated by Zn absorption and status, and are frequently used as indices of Zn status or bioavailability in a wide variety of species (1,25,28,32–40).
The primary objective of the studies described here was to compare the bioavailability of chelated Zn with that of Zn sulfate in chicks fed corn-soybean meal (C-SBM) diets both in the absence and presence of elevated Ca and P. Tibia Zn and small intestinal MT mRNA expression were used to measure Zn bioavailability.
Materials and methods
General
A Zn depletion–repletion broiler chick model was used to evaluate Zn bioavailability. Cobb 500 male broiler chicks were randomly assigned to dietary treatments in a randomised complete block design for each experiment.
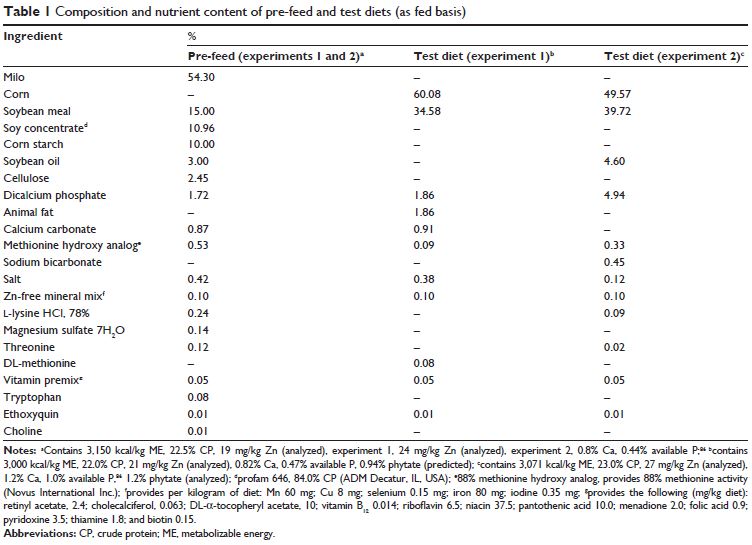
All birds were placed on a common, low Zn milo-soybean meal (SBM) pre-treatment diet (Table 1, 19 mg Zn/kg diet, experiment 1; 24 mg Zn/kg diet, experiment 2; Zn difference due to use of different ingredient lots) on day 0, and then switched to C-SBM treatment diets (Table 1) on day 8.
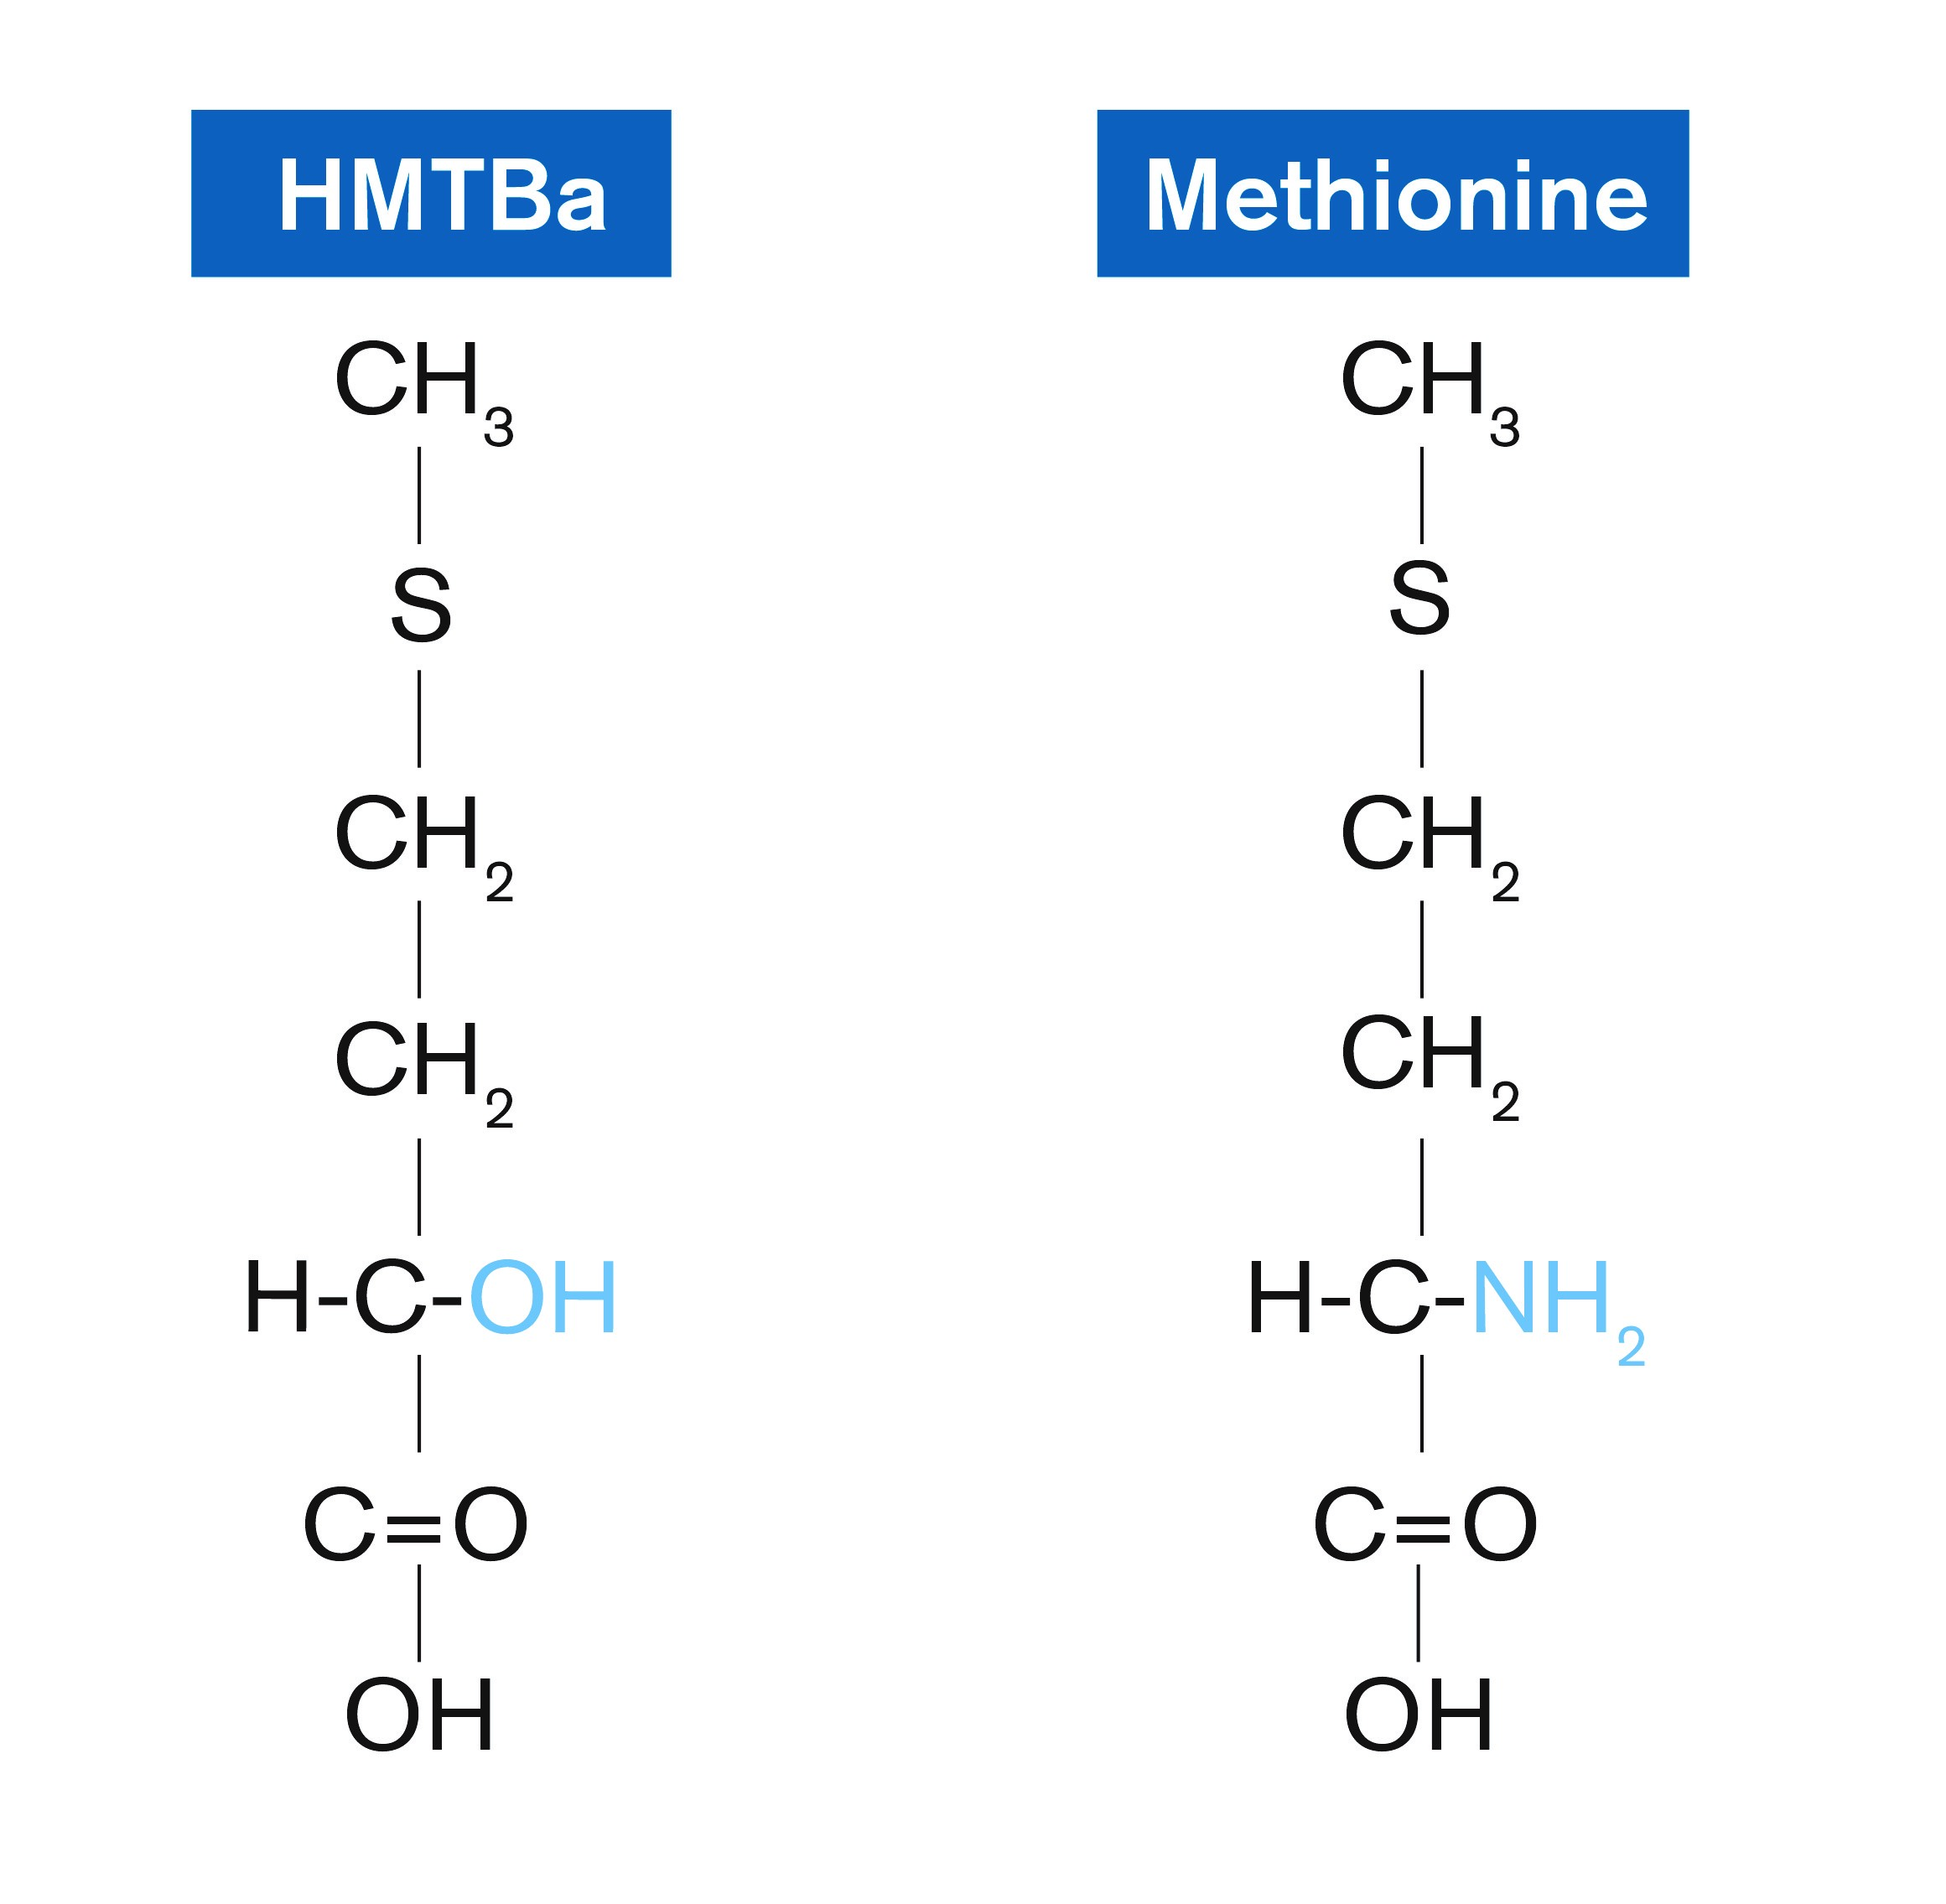
The treatment diets were a Zn-unsupplemented C-SBM basal, or the basal supplemented with Zn provided as Zn sulfate (ZnSO4.H2O) or Zn methionine hydroxy analog chelate [Zn bis(-2-hydroxy-4-(methylthio)butanoic acid; ZnHMTBa; Novus International Inc., Saint Charles, MO, USA].
All diets were formulated based on standard US commercial nutrient specifications as reported in a leading agricultural survey (41) with two exceptions: in experiment 2, the Ca and P were substantially elevated to provide a dietary antagonism for Zn, and in each trial, the Zn concentrations of the pre-treatment diet and several treatment diets were below the levels recommended by the National Research Council (NRC; 40 mg Zn/kg diet) (42).
There were six replicates (pens) per treatment, except for the basal (treatment 1, experiment 1 only) which had 12 replicates, with eight chicks per replicate.
The small intestine (jejunum) was collected from one bird per pen (0, 15, and 30 mg Zn/kg diet supplemental Zn treatments; experiment 1) on day 11 (after 3 days on treatment diets) or two birds per pen (all treatments; experiment 2; also day 11) and assayed for MT expression as described below.
On day 14 (after 6 days on the treatment diets), the birds were weighed, and the right and left tibias were collected (analysed separately and averaged) from two birds per pen (all treatments) for Zn analysis by inductively coupled plasma optical emissions spectrometry, using an internally validated method based on AOAC 985.01.43.
The timing of the intestinal and tibia collections was based on other published depletion–repletion trials in rodents and birds (25,31,44,45). All birds were raised in electrically heated brooders. Each pen was provided with water and an individual feeder. All birds were allowed to consume mash feed and water ad libitum.
The animal protocols for all experiments were in accordance with the standard operating procedures of Novus International Inc., and complied with all federal and state statutes ensuring the humane and ethical treatment of experimental animals.
All birds were observed at least twice daily and mortality was recorded. Body weight, cumulative gain, cumulative (mortality-corrected) gain to feed ratio, feed intake, and mortality were calculated for days 8–14.
Experiment 1
A total of 576 Cobb 500 male broiler chicks were switched to a C-SBM basal diet after an 8-day pre-feed (analysed to contain 19 mg Zn/kg diet), and randomised to eleven dietary treatments using a randomised complete block design.
The treatment diets included a Zn-unsupplemented basal (analysed to contain 21 mg Zn/kg diet) or the basal supplemented with 5, 10, 15, 20, or 30 mg Zn/kg diet either as Zn sulfate or Zn methionine hydroxy analog chelate.
Calcium, available P, and total P were 0.82 per cent, 0.47 per cent, and 0.72 per cent, respectively. Phytate concentration was calculated to be 0.94 per cent.
Experiment 2
A total of 288 Cobb 500 male broiler chicks were switched to a C-SBM basal diet after an 8-day pre-feed (analysed to contain 24 mg Zn/kg diet), and randomised to six dietary treatments in a randomised complete block design.
The treatment diets were a Zn-unsupplemented (analysed to contain 27 mg Zn/kg diet) basal, or the basal supplemented with 15 or 30 mg Zn/kg diet as Zn sulfate or 7.5, 15, or 30 mg Zn/kg diet as chelated Zn.
In experiment 2, Ca (1.2 per cent) and P (available, 1 per cent; total, 1.3 per cent) were substantially elevated relative to the diets in experiment 1 through the inclusion of dicalcium phosphate. Phytate was calculated to be 0.95 per cent compared with an analysed concentration of 1.24 per cent.
Metallothionein gene expression
A section of jejunum, immediately posterior to the duodenal loop and approximately 10 cm in length, was collected and rinsed gently with 3–4 mL of ice-cold saline.
The jejunum was cut open lengthwise and placed mucosal side up on a clean cutting board. The mucosa from 6–8 cm of this section was scraped off with a glass slide and collected into 0.9 mL of RNAlater (Ambion, Austin, TX, USA), stored at 4°C overnight, and then stored at -20°C.
RNA was isolated twice independently from each sample using the High Pure RNA Tissue Kit (Roche Applied Science, Indianapolis, IN, USA) following the manufacturer’s instructions.
For each RNA preparation, the concentration of RNA was determined using a spectrophotometer and the concentration of RNA was adjusted to a maximum of 0.5 mg/mL by dilution with elution buffer.
The RNA samples were either used immediately, or frozen on dry ice and stored at -80°C until use.
First-strand complementary DNA synthesis was performed using the Transcriptor Reverse Transcriptase (Roche Applied Science), using the instructions supplied by the manufacturer. Each first-strand synthesis reaction contained 0.5 μg of total RNA.
The reverse transcription was performed in a thermocycler using the following programme: a 90-second denaturation step at 95°C; annealing for 30 seconds at 40°C; 30 minutes of complementary DNA synthesis at 55°C; and enzyme inactivation by 5 minutes denaturation at 85°C.
The reaction product was concentrated by ethanol precipitation, rinsed, and dried. The sample was then resuspended in 400 μL of nuclease-free water and A260/A280 was measured to ensure that complementary DNA concentration in each sample would fall within the range of concentration usable by the real time-polymerase chain reaction (PCR) assay.
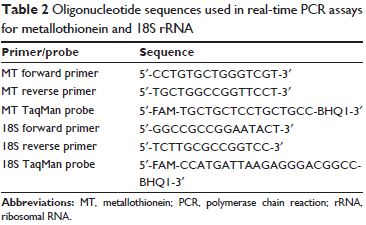
MT mRNA (normalized by 18S rRNA) was measured by real-time PCR, as follows. MT mRNA and 18S rRNA levels were measured by real time-PCR on a Roche LightCycler, using the LightCycler FastStart DNA Master HybProbe Kit (Roche Molecular Systems, Alameda, CA, USA) with 0.5 μM of each primer and 0.2 μM of each TaqMan probe.
Primers and probes are shown in Table 2.
The parameters of the assay were 42 cycles of 10 seconds at 95°C and 40 seconds at 60°C. While MT expression is inducible by Zn in many tissues, 18S rRNA expression was not Zn-inducible (data not shown).
MT mRNA levels therefore were normalized in each sample by 18S rRNA levels, as a loading control. In addition, each PCR run included a known reference standard, from small intestinal cells from a chick fed a low-Zn diet.
Data analysis was performed by RelQuant software (Roche Molecular Systems). This software automatically computes the concentrations between the target (MT) and a standard (18S rRNA), and then normalises this ratio to a previously established external reaction standard curve which corrects for the individual reaction efficiency differences between the MT and 18S assays.
The MT expression level was determined twice for each original intestinal sample (one for each independent RNA preparation), and the two values were averaged.
Statistical analyses
Pen means were used as the experimental units for all variables evaluated. For performance measures, all analyses of variance were performed using PROC GLM of SAS version 9.1 (SAS Institute Inc., Cary, NC, USA) appropriate for a randomised complete block design (46).
Statistical differences of treatment means comparisons were made with Fisher’s protected least significant difference test. For bioavailability measures, MT and tibia Zn (total Zn and Zn concentration) were regressed on supplemental Zn intake using predicted dietary Zn concentrations.
Zn bioavailability was determined using ZnSO4 ⋅ H2O as a standard by means of multiple linear regression and slope-ratio methodology.47–49 Standard errors were calculated for each regression coefficient.
In experiment 1, the REG procedure of SAS version 9.1 was used to test whether the relationship between tibia Zn and supplemental Zn intake was linear or quadratic for each Zn source.
When the quadratic effect was significant, a non-linear procedure of SAS (PROC NLIN) was used to determine the breakpoint using a model involving two linear splines with a plateau wherein the dependent variable, total tibia Zn (μg) or tibia Zn concentration (μg/g), was regressed on supplemental Zn intake (mg) (31,50).
This non-linear model defines both a linear response range and the inflection point. Levels falling below the inflection points were used to determine Zn bioavailability using the estimate statement of PROC GLM of SAS version 9.1, with ZnSO4.H2O as the standard.
Simple linear regression (PROC GLM) was used to compare ZnSO4 slopes between experiments 1 and 2 because tibia Zn concentration intercepts were significantly different between experiments.
A non-linear procedure of SAS (PROC NLIN) was used to compare slopes, breakpoints, and plateau values between experiments 1 and 2 for Zn-HMTBa. Statistical differences of treatment mean comparisons were made with Fisher’s protected least significance based on a probability of P,0.05.
Results
Experiment 1
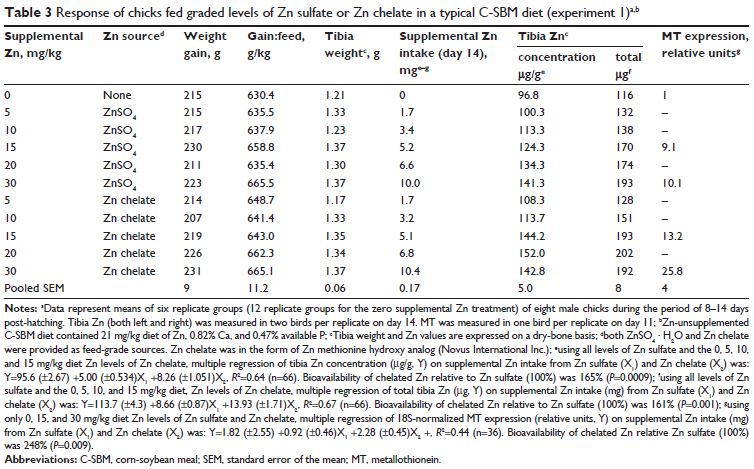
There were no significant source or treatment effects on days 8–14 on weight gain, feed conversion, or tibia weight (Table 3).
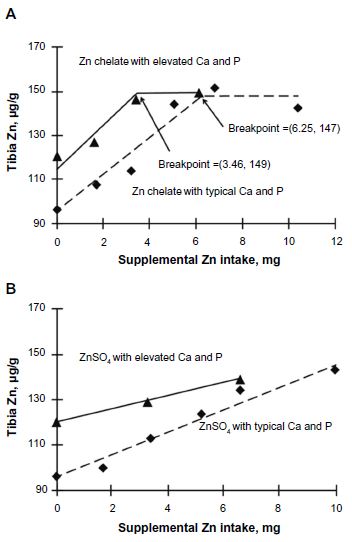
Tibia Zn (μg) was regressed against supplemental Zn intake (mg) for each source. For Zn sulfate, the relationship between total tibia Zn and supplemental Zn intake was linear (Figure 1A; P,0.0001), whereas for chelated Zn the relationship was quadratic (Figure 1A; P=0.0006). A breakpoint of 5.9 (±0.77) mg of supplemental Zn intake was determined for chelated Zn, which equates to 17.4 mg supplemental Zn/kg diet (38.4 mg total dietary Zn/kg) for this Zn source.
Levels below the breakpoint for chelated Zn (0–15 mg Zn/kg diet supplemental Zn) and all levels of Zn sulfate were used to determine the slope (total tibia Zn regressed on supplemental Zn intake) for each source using multiple regression.
The slopes of the two sources (Zn sulfate slope 8.66; Zn chelate slope 13.93), and thus their RBVs were significantly different (P=0.001; Figure 1A and Table 3).
With the total tibia Zn response to Zn sulfate set at 100 per cent, slope-ratio analysis estimated that the RBV of Zn chelate was 161 per cent (Figure 1A and Table 3).
A similar Zn RBV (165 per cent, P=0.0009) was also obtained when tibia Zn concentration (μg/g) was regressed on supplemental Zn intake (mg; Table 3). Small intestinal MT mRNA expression (relative units) was also regressed on supplemental Zn intake (mg).
As with tibia Zn, the slopes of the two sources (Zn sulfate slope 0.92; Zn chelate slope 2.28), and thus their RBVs were significantly different (P=0.009; Figure 1B). With the MT response to Zn sulfate set at 100 per cent, the estimated RBV of Zn from Zn chelate was 248 per cent (Figure 1B and Table 3).
Experiment 2
There was no Zn source or treatment effect on weight gain, feed efficiency, or tibia weight (Table 4). However, compared with experiment 1, weight gain and feed intake were substantially reduced as a result of the elevated Ca and P levels.
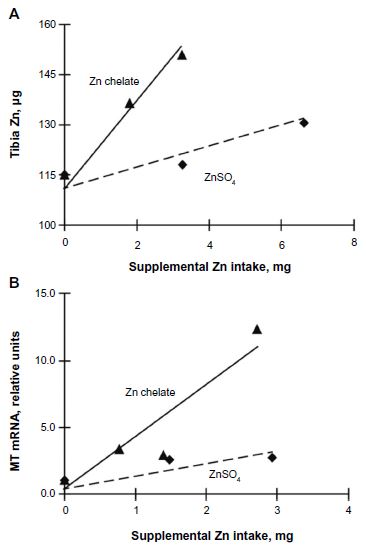
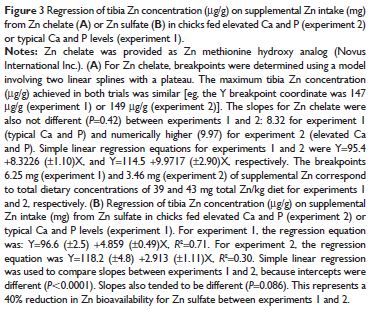
Tibia Zn (both concentration [μg/g] and total Zn [μg]) responded linearly (P,0.05) to supplemental Zn intake for both Zn sources; however, similar to experiment 1, tibia Zn (concentration and total) in birds fed chelated Zn responded linearly only up to 15 mg/kg supplemental Zn (Figure 2A and 3A; and Table 4).
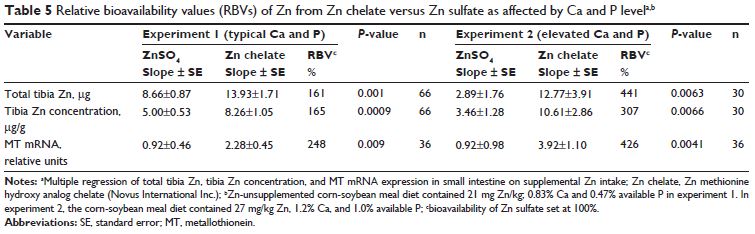
Furthermore, tibia Zn concentration reached a similar plateau in both experiments, although this plateau was only reached with chelated Zn (147 μg/g in experiment 1; 149 μg/g in experiment 2; Figure 3A).
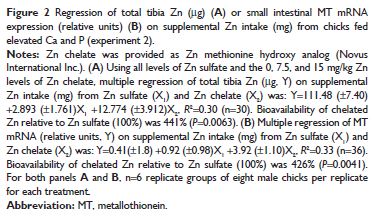
Multiple linear regression slope-ratio analysis indicated that the slope of the total tibia Zn (μg) curve was 441 per cent (P=0.0063) for chelated Zn relative to Zn sulfate (Figure 2A and Table 4), whereas the RBV estimate for tibia Zn concentration (μg/g) curve for chelated Zn (using only chelated Zn levels below the breakpoint) was 307 per cent (P=0.0066) relative to Zn sulfate (Table 4).
Slope-ratio analysis of small intestinal MT mRNA expression indicated that the estimated bioavailability of chelated Zn was 426 per cent (P=0.0041) relative to Zn sulfate (Figure 2B and Table 4).
Differential effects of Ca/P excess on Zn source
As shown in Figure 3A, the tibia Zn (μg/g) slopes for Zn chelate were not different (8.32 and 9.97 for Zn chelate in experiments 1 and 2, respectively; P=0.42) between experiments 1 and 2, indicating little or no antagonism by the elevated Ca and P.
In fact, the slope was numerically higher (19.8 per cent increase) in experiment 2. In contrast, there was a 40 per cent reduction in slope (4.86 and 2.91 in experiments 1 and 2, respectively; P=0.086) for Zn sulfate in the presence of elevated Ca and P (Figure 3B).
Similar results were seen when total tibia Zn (μg) was compared (data not shown); the Zn sulfate bioavailability (slope 8.66 versus 2.89 for ZnSO4, experiments 1 versus 2, respectively; P,0.0001) was reduced by the antagonism much more dramatically (66.6 per cent reduction) than the Zn chelate (slope 13.93 versus 12.77 for Zn chelate, experiments 1 versus 2, respectively; P=0.57, or 8.3 per cent reduction).
These results suggest that the Zn sulfate was antagonized by elevated Ca and P to a much greater extent than the Zn chelate.
Consistent with these results, the tibia Zn breakpoint (y coordinate) did not change appreciably in response to elevated Ca and P when the Zn chelate was fed (147 versus 149 μg/g; Figure 3A).
Although the x-breakpoint coordinates appear to be different (6.25 mg supplemental Zn in experiment 1 versus 3.46 mg supplemental Zn in experiment 2), these breakpoints (based on total dietary concentrations) are, in fact, quite similar: 18 versus 16 mg supplemental Zn/kg diet, or 39 versus 43 mg total Zn/kg diet for experiments 1 and 2, respectively.
Note that a plateau for tibia Zn concentration was not reached for Zn sulfate in either trial, but if one assumes that the threshold for tibia Zn concentration when Zn sulfate is fed would be the same as it is when Zn chelate is fed (148 μg/g, the average of the y coordinate from breakpoint estimates obtained from Figure 3A), then one can calculate the amount of Zn sulfate required to meet this threshold from best-fit equations (see Figure 3 legend for equation).
Our calculations indicate that in the presence of elevated Ca and P, 10.23 mg supplemental Zn intake from Zn sulfate (equates to 46 mg supplemental Zn/kg diet or 73 mg total Zn/kg diet; experiment 2) would be necessary to reach this threshold, compared with only 3.46 mg for Zn chelate.
This represents a threefold difference in amount of Zn needed (Zn sulfate versus Zn chelate) to maximise tibia Zn concentration (μg/g tibia). This estimate (10.23/3.46 = 2.96, or 296 per cent) agrees closely with the 307 per cent RBV estimate determined for tibia Zn concentration in experiment 2 by the slope-ratio methodology (Table 4).
In the absence of elevated Ca and P (experiment 1), the amount of Zn sulfate necessary to maximize tibia Zn concentration was calculated to be 10.58 mg supplemental Zn, which equates to 32 mg supplemental Zn/kg diet or 53 mg total Zn/kg diet, whereas the plateau was reached at 6.25 mg supplemental Zn intake for the Zn chelate (Figure 3A).
Thus, the bioavailability for Zn chelate is calculated to be (10.58/6.25 = 1.69) or 169 per cent, again in close agreement with the 165 per cent calculated by the slope-ratio method.
Table 5 compares the Zn bioavailability of Zn chelate relative to that of Zn sulfate as determined for tibia Zn (concentration and total) and small intestinal MT expression in experiments 1 and 2 using slope-ratio methodology.
Discussion
The data from our study indicate that a chelated Zn form is more bioavailable than Zn sulfate in standard balanced diets, and the bioavailability of chelated Zn relative to Zn sulfate increases dramatically in the presence of added Ca and P as antagonists.
Consistent with this finding, the tibia Zn data suggest that Zn sulfate appeared to be antagonised by elevated Ca and P, but chelated Zn was not.
Indeed, the slope for Zn sulfate was 40 per cent lower in experiment 2 when compared with experiment 1, suggesting the Zn sulfate was antagonized by excess Ca and P.
In contrast, the slope for chelated Zn was not different between experiment 2 and experiment 1, indicating that the Zn chelate was not antagonized by excess Ca and P.
Collectively, these findings demonstrate the potential advantages of a chelated trace mineral over an inorganic salt, especially under dietary conditions where antagonisms are present.
With regard to plausible explanations for the observed difference in bioavailability, several possibilities exist.
One theory, proposed by Kratzer and Vohra, is that chelates have the ability to compete with phytic acid or other antagonists such as Ca and P, for its Zn-binding capacity (51). The Zn contained within the chelate forms a soluble complex with Zn and, consequently, is available to the animal.
In contrast, once complexed with phytate or other divalent minerals, the Zn present in inorganic sources is functionally unavailable.
Chelates have stronger chemical bonds relative to those in inorganic trace metals, ie, compare the coordinate, covalent bond formed between the two ligands and metal, versus ITMs possessing a weaker ionic bond (52). Thus, chelates are more resistant to antagonisms.
An alternative possibility is that organic Zn sources are absorbed via peptide or amino acid transport systems, resulting in higher digestibility and bioavailability (53).
The published data concerning advantages of OTM versus ITM bioavailability are mixed. Some publications report significantly greater bioavailabilities of certain OTMs compared with ITMs (24,31,54–56), whereas many report no differences (23–26,57).
Indeed, Schlegel et al. recently published a meta-analysis of RBV studies combining a variety of different organic Zn sources, and concluded that, overall, organic Zn sources are not different in bioavailability from inorganic sources (57).
The chelated Zn used in the current study was not part of this meta-analysis. These inconsistencies could be due to differences in chemical characteristics (and thus bioavailability) between different OTM forms, or could merely be a reflection of flaws in experimental design that prevent the detection of real differences.
It should be noted that the supplemental Zn levels in many of these experiments were beyond the linear response range, or above the tissue Zn breakpoint, which can minimise differences between sources (31,57,58). Multiple papers, for example, have reported no difference in RBV between Zn sulfate and Zn methionine when supplemented at high levels (31,34,57).
The lack of difference in Zn bioavailability at high levels of supplementation is likely due to homeostatic mechanisms at the level of Zn absorption.
Expression levels of Zn transporter proteins required for uptake (primarily Zip4 in humans and mice) and export (ZnT1) are both modulated by Zn status of the tissues (1,59–62). Zip protein expression increases in deficiency and decreases at excess; the ZnT transporters are modulated in the opposite manner.
When a given tissue (for example, the tibia) has reached peak Zn concentrations, net Zn uptake will decrease through these mechanisms. Thus, lack of a tibia Zn difference between Zn sources at high levels of supplementation, above the tibia Zn inflection point, likely simply reflect a downregulation of net Zn import by that tissue rather than an inherent difference in bioavailability per se.
Faster growth rates of poultry and swine over the last two decades have been accompanied by substantial increases in the incidence and severity of a variety of skeletal and other structural problems, including lameness, bone breakage, tibial dyschondroplasia in poultry, and osteochondrosis in pigs, which are often attributed to poor mineral nutrition (63–66).
As a result of these issues, trace minerals are often fed at levels that far exceed published NRC requirements (42). Despite higher feeding rates, these structural problems persist, likely due to poor mineral bioavailability and mineral–mineral antagonisms resulting from feeding high mineral concentrations.
One might predict that feeding trace mineral forms that resist antagonism and are more bioavailable would reduce the incidence of these problems.
A minor limitation of most Zn bioavailability trials is that comparisons between Zn sources are made at deficient or marginal levels of Zn intake. Consequently, it is debated by some that the bioavailability estimates determined at deficient or marginal levels of Zn intake may not be applicable to commercial situations, wherein typical Zn levels exceed Zn requirements by two- to threefold (42).
Due to homeostatic mechanisms discussed previously (vide supra), little to no differences in bioavailability (as measured by bone Zn or MT) occur at dietary Zn intakes above the requirement, but the advantages in bioavailability are still evident in other biological measurements.
Despite the lack of observed differences in this study between Zn sources for animal performance (eg, weight gain, feed intake) or bone Zn at levels above the breakpoint or commercially relevant Zn concentrations, the superior bioavailability of Zn chelate observed at low Zn intake is associated with numerous physiological benefits under commercial conditions.
For example, significant advantages of chelated ZnHMTBa, in combination with Mn and CuHMTBa versus ITMs have been demonstrated in turkeys and broilers in field trials, wherein commercial levels of trace minerals were compared.
In studies comparing iso-Zn, Cu, and Mn HMTBa versus ITMs, improvements included increased bone strength and width, improved foot pad score, reduced incidence of tibial dyschondroplasia, and reduced incidence of synovitis (2,67).
In addition, in a recent commercial broiler trial, birds fed reduced Zn, Cu, and Mn HMTBa (32, 8, and 32 mg/kg diet, respectively) had significantly improved footpad scores relative to broilers fed commercial levels of ITM Zn, Cu, and Mn (100, 125, and 90 mg/kg diet, respectively) (68).
Studies in broilers also demonstrated reductions in bacterial chondronecrosis with osteomyelitis with Zn, Cu, and Mn HMTBa supplementation (64:16:64 mg/kg diet, respectively) versus ITM (100:125:90 mg/kg diet, respectively) (69).
It has recently been reported that sows fed a 50:50 mixture of OTM:ITMs (Zn, Cu, and Mn HMTBa) exhibited a significant reduction in their overall culling rate when compared with control animals fed similar mineral concentrations as 100 per cent inorganic mineral control (165:16:38 mg/kg diet; ZnO, CuSO4, and MnO, respectively) (70).
In addition to improved skeletal integrity, chelated mineral sources also provide improved immunity (71–73), decreased oxidative stress (72,74) and decreased environmental burden (68).
Furthermore, trace mineral studies comparing Zn, Cu, and Mn HMTBa (individually) versus corresponding sulfates in laying hens reported significant increases in eggshell thickness, Haugh units (a measure of increased egg white height associated with increased freshness and extended shelf-life), and enzyme activity including ceruloplasmin, carbonic anhydrase, and Mn superoxide dismutase (75).
Thus, reported advantages of chelated minerals over inorganic mineral sources are related to improved structural and skeletal integrity, improved immune function, increased enzyme activity, and decreased oxidative stress.
Given the marked changes that have occurred with today’s commercial broilers and turkeys (eg, improved genetic selection, faster growth rates, and birds being grown to heavier market weights), it seems appropriate for future NRC poultry committees to consider recommending the use of chelated minerals for their demonstrated potential in reducing egg breakage (laying hens), tibial dyschondroplasia, synovitis, footpad lesions, chondronecrosis with osteomyelitis, and other issues associated with fast growth in poultry.
Surprisingly, the tibia Zn concentrations were higher for birds fed the elevated Ca and P diets (experiment 2; unsupplemented or low Zn treatments) compared with birds fed normal Ca and P (experiment 1), until they reached a common plateau (Figure 3).
The excesses of both Ca and P in experiment 2 reduced feed intake and body weight, resulting in smaller tibias and, given the similar tibia Zn content, a higher tibia Zn concentration. Similar tibia Zn concentrations ([μg/g], but not total tibia Zn [μg]), between the two experiments (at higher Zn intake) was not expected, but we believe this can be explained by differential partitioning of Zn to the tissues along with the homeostatic mechanisms discussed above.
Zn deficiency in the young (eg, applies to livestock, pets, and humans) is characterised primarily by retardation of whole-body growth rather than by changes in tissue Zn content (76). With Zn deficiency, the body reduces intake in an attempt to maintain Zn concentrations in tissues: enzyme activity and organ/tissue concentrations are prioritized over growth.
Zn concentrations of some tissues (eg, blood, hair, bone, testes, liver), but not others (eg, brain, lung, muscle, heart) are very sensitive to changes in Zn intake;76 consequently, Zn is partitioned, preferentially, to some tissues versus others.
In chicks, for example, approximately 35 per cent of whole-body Zn is stored in the bone, even though the bone only comprises 19 per cent of dry body weight (77).
Thus, we believe that, in the case of Zn deficiency imposed in experiment 2, Zn was preferentially targeted to the bone, likely at the expense of some other tissues, until it reached the plateau.
In contrast to the differing tibia Zn concentrations in birds fed diets without supplemental Zn, the plateau was very similar between experiments (147 versus 149 μg/g for tibia Zn concentration in experiments 1 and 2, respectively), suggesting that homeostatic mechanisms are working to ensure optimal concentrations of Zn in the bone.
Although no Zn source differences in weight gain, feed efficiency, or tibia weight were observed in experiments 1 and 2, there were significant differences in these measurements between experiments, most likely attributed to the excess of Ca and P.
It is widely known that excesses of Ca and P or imbalanced Ca:P ratios depress weight gain (31,78). However, previous studies utilising C-SBM diets have clearly demonstrated improved Zn status between ITM and OTM Zn sources, as measured by Zn bioavailability differences or antioxidant status, yet show no significant difference in animal performance (eg, bodyweight or weight gain) (30,31,73).
There were no skeletal issues or lameness observed in our studies, possibly due to the short duration of our study, and/or due to only a marginal Zn deficiency. Dietary antagonists such as phytic acid, fiber, sulfates, high levels of other trace minerals such as Cu, and potentially high levels of Ca and/or P are common in livestock diets.
A Ca level of 4.5 per cent is not uncommon in laying hen diets, nor is 1 per cent Ca uncommon in dairy diets, and high concentrations of Ca and P are commonly fed to turkeys. Elevated Ca and P levels are also prevalent in pet food (79).
Based on a survey of 194 wet and dry dog foods, Ca concentrations ranged from 0.6 per cent to 4.1 per cent (mean 1.4 per cent; median 1.3 per cent) and P concentrations ranged from 0.4 per cent to 2.4 per cent (mean 1.1 per cent; median 1.0 per cent).
In comparison, the dietary levels of Ca recommended by the Association of American Feed Control Officials (AAFCO), which sets nutrient guidelines for the pet food industry in the USA, and the NRC are 0.6 per cent and 0.4 per cent, respectively (80,81); the dietary levels of P recommended by AAFCO and the NRC are 0.5 per cent and 0.3 per cent, respectively (80,81).
Similarly, based on a survey of 137 cat foods (wet and dry), Ca concentrations ranged from 0.5 per cent to 3.5 per cent (mean 1.3 per cent; median 1.2 per cent) and P concentrations ranged from 0.5 per cent to 2.5 per cent (mean 1.1 per cent; median 1.1 per cent).
In comparison, the dietary levels of Ca recommended by AAFCO and the NRC are 0.6 per cent and 0.29 per cent, respectively (80,81), and the dietary levels of P recommended by AAFCO and the NRC are 0.5 per cent and 0.26 per cent, respectively (80,81).
Thus, the levels of Ca and P evaluated in experiment 2 (eg, 1.2 per cent Ca, 1.3 per cent total P, 1 per cent available P) would not be uncommon in commercial pet foods. As such, Zn deficiency in dogs and cats may be a concern.
Indeed, studies have demonstrated higher Zn requirements in dog foods containing high levels of Ca. One paper reported that puppies fed a standard diet containing 33 mg Zn/kg diet and 1.1 per cent Ca developed signs of Zn deficiency, whereas puppies fed the same level of Zn and 0.3 per cent Ca did not (82).
Similarly, others induced a Zn deficiency in puppies fed 20–35 mg Zn/kg diet and 2.64 per cent Ca (83,84). Control puppies fed the same diet but supplemented with 120 mg Zn/kg diet grew normally and demonstrated no clinical signs of Zn deficiency.
There have also been a number of reports of naturally occurring Zn deficiency syndromes in dogs fed commercial dog foods (81).
Zn deficiency symptoms include poor growth rate and/or significant skin lesions, which initially occur in areas of contact or wear such as foot pads (82).
AAFCO recommends a 120 mg Zn/kg diet for dogs, concentrations that are twofold higher than minimum NRC recommendations (eg, 60 mg Zn/kg diet), probably higher because of the high Ca levels and/or phytate present in some commercial dog foods (80). Collectively, these data suggest that certain dietary conditions (high Ca and P) potentially induce Zn deficiency in dogs and cats.
Our data suggest that feeding a chelated Zn form could prevent antagonism-induced Zn deficiency. Interestingly, published data have shown that another chelated Zn form was able to resist Ca-induced Zn antagonism in dogs (85).
Our study had some limitations, strengths, and difficulties. One limitation was the lack of control treatments (typical Ca and P concentrations) in experiment 2. Our comparison of experiments 1 and 2 (Figure 3), for example, was confounded by trial.
It would have been more appropriate to compare Zn bioavailability between Zn sources under dietary conditions of low Ca/P versus elevated Ca/P within the same trial.
Nonetheless, other researchers, using similar C-SBM basal diets (without antagonists) and similar commercial poultry strains (Ross White versus Cobb 500 in our study), yielded similar linear response ranges, breakpoints, and slopes.
Thus, the statistical methodology is repeatable between studies and different researchers; thus, we believe our comparisons between experiments 1 and 2 and our conclusions are valid.
For example, Jondreville et al also utilised a linear plateau model to define breakpoints and slopes for tibia Zn concentration (expressed as μg/g) for Zn sulfate, and their results were in close agreement with our trial (eg, breakpoints were 51 versus 53 mg Zn/kg diet (see “Results”; the breakpoint for Zn sulfate was predicted, not determined in our study), and their slope for Zn sulfate was 4.48 versus 5.00 in our study) (58).
Despite these limitations, this study utilised robust experimental and statistical methodologies, in commercially relevant diets, to elucidate the bioavailability differences between a chelated Zn form and Zn sulfate.
Defining the linear response range, the statistical design of our study, and use of C-SBM diets were some of the strengths of our study.
Slope-ratio multiple regression analyses is a sensitive statistical methodology used to assess bioavailability (more powerful than pair-wise comparison procedures), but also has its difficulties, which we attempted, where possible, to address.
A linear response range is necessary in order to compare slopes, and it is critical to define the response change in order to ensure treatment doses do not fall in the plateau range.
In the case of C-SBM diets, it is especially difficult to formulate a Zn-deficient diet. Typical Zn concentrations in SBM, in our experience, range from 44 mg to 125 mg Zn/kg; thus, it is necessary to screen multiple lots of SBM to identify lots low enough in Zn to create low Zn C-SBM basal diets.
In our study, basal diets varied between 21 mg and 27 mg Zn/kg diet; the breakpoint for bone Zn for chelated Zn was 38 mg Zn/kg diet, so the linear response range was quite narrow (11–17 mg/kg Zn).
Furthermore, due to the heterogeneity and low Zn concentrations of our diets, it can be difficult for analysed Zn to agree closely with predicted values (analytical variance for Zn is 20 per cent).80 It would be more convenient to use semi-purified diets for Zn bioavailability studies, thus achieving lower dietary Zn concentrations and wider response ranges.
However, we believed it was critical that our experimental diets simulate commercially relevant diets in order to obtain data that would be meaningful in the real world. Additionally, the presence of phytate (common in cereal grains and legumes) is an important antagonism that reduces Zn bioavailability, thus maximizing bioavailability differences between inorganic and chelated Zn sources.
For example, Wedekind et al compared the bioavailability of an OTM (Zn methionine) versus Zn sulfate in a purified amino acid diet devoid of phytate and fiber and also compared these same Zn sources in a C-SBM diet (31).
The bioavailability of Zn methionine relative to Zn sulfate was markedly different (117 per cent in the amino acid diet and 206 per cent in the C-SBM diet). In the presence of antagonisms (ie, phytate, fiber, and/or elevated Ca and P), bioavailability differences between OTMs and ITMs are increased.
Thus, the basal diet used to assess Zn bioavailability is critical and dietary characteristics such as phytate, fiber, Ca, and P levels, should simulate commercial conditions. Lastly, the advantages of chelated minerals are often overlooked.
A recent meta-analysis concluded no differences between OTMs and ITMs (57). Thus, an additional strength of our study was, with careful attention to study details, our ability to show a bioavailability advantage of this particular Zn chelate versus Zn sulfate.
In summary, the bioavailability of a chelated Zn source relative to Zn sulfate was compared utilising a Zn depletion–repletion model, with two measures of Zn bioavailability assessed (tibia Zn and MT mRNA).
The results of this study indicate that chelated Zn provided more bioavailable Zn than inorganic Zn. The greater bioavailability of chelated versus inorganic Zn sources under conditions of dietary antagonisms may be especially important to livestock and pets wherein high levels of Ca and P may be present.
In addition, this advantage of chelates demonstrated under conditions of elevated Ca and P, may also be present under other dietary antagonisms, such as phytate, excess Cu, excess Fe, and others.
Acknowledgements
The authors wish to thank B Wuelling and M Wehmeyer for assisting with the conduct of the trial, and Cindy Atwell and Terra Wineman for assistance with sample collection.
Disclosure
PMF, JLE, and KJW are employees of Novus International Inc. (Saint Charles, MO, USA) which manufactures and markets OTM products, including Zn chelated to 2-hydroxy-4-(methylthio)butanoic acid (Mintrex® Zn). JDR was an employee of Novus during the course of the study, analysis of the data, and preparation of the manuscript (current affiliation: Department of Global Regulatory and Nutrition Science, Mead Johnson Nutrition, Evansville, IN 47721 USA).
References
1. Blanchard RK, Moore JB, Green CL, Cousins RJ. Modulation of intestinal gene expression by dietary zinc status: effectiveness of cDNA arrays for expression profiling of a single nutrient deficiency. Proc Natl Acad Sci USA. 2001;98:13507–13513.
2. Dibner JJ, Richards JD, Kitchell ML, Quiroz MA. Metabolic challenges and early bone development. J Appl Poult Res. 2007;16:126–137.
3. Fraker PJ, King LE, Laakko T, Vollmer TL. The dynamic link between the integrity of the immune system and zinc status. J Nutr. 2000;130: 1399S–1406S.
4. MacDonald RS. The role of zinc in growth and cell proliferation. J Nutr. 2000;130:1500S–1508S.
5. Miao D, Liu H, Plut P et al. Impaired endochondral bone development and osteopenia in Gli2-deficient mice. Exp Cell Res. 2004;294: 210–222.
6. Powell SR. The antioxidant properties of zinc. J Nutr. 2000;130: 1447S–1454S.
7. Shankar AH, Prasad AS. Zinc and immune function: the biological basis of altered resistance to infection. Am J Clin Nutr. 1998;68:447S–463S.
8. Song Y, Leonard SW, Traber MG, Ho E. Zinc deficiency affects DNA damage, oxidative stress, antioxidant defenses, and DNA repair in rats. J Nutr. 2009;139:1626–1631.
9. Starcher BC, Hill CH, Madaras JG. Effect of zinc deficiency on bone collagenase and collagen turnover. J Nutr. 1980;110:2095–2102.
10. Underwood EJ, Suttle NF. The Mineral Nutrition of Livestock. 3rd ed. New York, NY, USA: CABI; 1999.
11. Vallee BL, Falchuk KH. The biochemical basis of zinc physiology. Physiol Rev. 1993;73:79–118.
12. Leeson S, Summers JD, Scott ML. Nutrition of the Chicken. 4th ed. Guelph, ON, Canada: University Books; 2001.
13. Oberleas D, Muhrer ME, O’Dell BL. Dietary metal-complexing agents and zinc availability in the rat. J Nutr. 1966;90:56–62.
14. Cabell CA, Earle IP. Additive effect of calcium and phosphorus on utilization of dietary zinc. J Anim Sci. 1965;24:800–804.
15. Heth DA, Becker WM, Hoekstra WG. Effect of calcium, phosphorus and zinc on zinc-65 absorption and turnover in rats fed semipurified diets. J Nutr. 1966;88:331–337.
16. O’Dell BL. Bioavailability of trace elements. Nutr Rev. 1984;42: 301–308.
17. Gibson RS. A historical review of progress in the assessment of dietary zinc intake as an indicator of population zinc status. Adv Nutr. 2012;3: 772–782.
18. Greger JL. Effects of phosphorous-containing compounds on iron and zinc utilization. In: Kies C, editor. Nutritional Bioavailability of Iron. 1st ed. Washington, DC, USA: American Chemical Society; 1982.
19. Zemel MB, Bidari MT. Zinc, iron, and copper availability as affected by orthophosphates, polyphosphates, and calcium. J Food Sci. 1983;48: 567–569.
20. Roberson RH, Schaible PJ. The effect of elevated calcium and phosphorus levels on the zinc requirement of the chick. Poult Sci. 1960;39:837–840.
21. Pond WG, Walker EF Jr, Kirtland D. Weight gain, feed utilization and bone and liver mineral composition of pigs fed high or normal Ca-P diets from weaning to slaughter weight. J Anim Sci. 1975;41:1053–1056.
22. Pond WG, Walker EF Jr, Kirtland D. Effect of dietary Ca and P levels from 40 to 100 Kg body weight on weight gain and bone and soft tissue mineral concentrations. J Anim Sci. 1978;46:686–691.
23. Baker DH, Ammerman CB. Zinc bioavailability. In: Ammerman CB, Baker DH, Lewis AJ, editors. Bioavailability of Nutrients for Animals: Amino Acids, Minerals, and Vitamins. 1st ed. San Diego, CA, USA: Academic Press; 1995.
24. Cao J, Henry PR, Guo R, et al. Chemical characteristics and relative bioavailability of supplemental organic zinc sources for poultry and ruminants. J Anim Sci. 2000;78:2039–2054.
25. Huang YL, Lu L, Li SF, Luo XG, Liu B. Relative bioavailabilities of organic zinc sources with different chelation strengths for broilers fed a conventional corn-soybean meal diet. J Anim Sci. 2009;87:2038–2046.
26. Mohanna C, Nys Y. Effect of dietary zinc content and sources on the growth, body zinc deposition and retention, zinc excretion and immune response in chickens. Br Poult Sci. 1999;40:108–114.
27. Ammerman CB, Baker DH, Lewis AJ. Introduction to bioavailability of nutrients for animals. In: Ammerman CB, Baker DH, Lewis AJ, editors. Bioavailability of Nutrients for Animals: Amino Acids, Minerals, and Vitamins. 1st ed. San Diego, CA, USA: Academic Press; 1995.
28. Cao J, Henry PR, Davis SR, et al. Relative bioavailability of organic zinc sources based on tissue zinc and metallothionein in chicks fed conventional dietary zinc concentrations. Anim Feed Sci Technol. 2002;101:161–170.
29. Sandoval M, Henry PR, Ammerman CB, Miles RD, Littell RC. Relative bioavailability of supplemental inorganic zinc sources for chicks. J Anim Sci. 1997;75:3195–3205.
30. Wedekind KJ, Baker DH. Zinc bioavailability in feed-grade sources of zinc. J Anim Sci. 1990;68:684–689.
31. Wedekind KJ, Hortin AE, Baker DH. Methodology for assessing zinc bioavailability: efficacy estimates for zinc-methionine, zinc sulfate, and zinc oxide. J Anim Sci. 1992;70:178–187.
32. Aydemir TB, Blanchard RK, Cousins RJ. Zinc supplementation of young men alters metallothionein, zinc transporter, and cytokine gene expression in leukocyte populations. Proc Natl Acad Sci U S A. 2006;103: 1699–1704.
33. Bittel D, Dalton T, Samson SL, Gedamu L, Andrews GK. The DNA binding activity of metal response element-binding transcription factor-1 is activated in vivo and in vitro by zinc, but not by other transition metals. J Biol Chem. 1998;273:7127–7133.
34. Cao J, Cousins RJ. Metallothionein mRNA in monocytes and peripheral blood mononuclear cells and in cells from dried blood spots increases after zinc supplementation of men. J Nutr. 2000;130:2180–2187.
35. Carlson D, Beattie JH, Poulsen HD. Assessment of zinc and copper status in weaned piglets in relation to dietary zinc and copper supply. J Anim Physiol Anim Nutr (Berl). 2007;91:19–28.
36. Davis SR, Cousins RJ. Metallothionein expression in animals: a physiological perspective on function. J Nutr. 2000;130:1085–1088.
37. Martinez MM, Hill GM, Link JE, Raney NE, Tempelman RJ, Ernst CW. Pharmacological zinc and phytase supplementation enhance metallothionein mRNA abundance and protein concentration in newly weaned pigs. J Nutr. 2004;134:538–544.
38. McCormick CC, Menard MP, Cousins RJ. Induction of hepatic metallothionein by feeding zinc to rats of depleted zinc status. Am J Physiol. 1981;240:E414–E421.
39. Rojas LX, McDowell LR, Cousins RJ, et al. Relative bioavailability of two organic and two inorganic zinc sources fed to sheep. J Anim Sci. 1995;73:1202–1207.
40. Sullivan VK, Burnett FR, Cousins RJ. Metallothionein expression is increased in monocytes and erythrocytes of young men during zinc supplementation. J Nutr. 1998;128:707–713.
41. Driver JP, Pesti GM, Bakalli RI, Edwards HM Jr. Calcium requirements of the modern broiler chicken as influenced by dietary protein and age. Poult Sci. 2005;84:1629–1639.
42. National Research Council (US), Subcommittee on Poultry Nutrition. Nutrient Requirements of Poultry. 9th ed. Washington, DC, USA: National Academy Press; 1994.
43. Association of Official Agricultural Chemists International. Official Methods of Analysis of AOAC International. 18th ed. Gaithersburg, MD, USA: Association of Official Agricultural Chemists International; 2005.
44. Reeves PG. Adaptation responses in rats to long-term feeding of high-zinc diets: emphasis on intestinal metallothionein. J Nutr Biochem. 1995;6:48–54.
45. Szczurek EI, Bjornsson CS, Taylor CG. Dietary zinc deficiency and repletion modulate metallothionein immunolocalization and concentration in small intestine and liver of rats. J Nutr. 2001;131:2132–2138.
46. SAS Institute. SAS User’s Guide. 9th ed. Cary, NC, USA: SAS Institute; 2003.
47. Finney DJ. Statistical Method of Biological Assay. 3rd ed. London, UK: Charles Griffith; 1978.
48. Draper NR, Smith H. Applied Regression Analysis. 2nd ed. New York, NY, USA: John Wiley and Sons; 1981.
49. Littell RC, Stroup WW, Freund RJ. SAS for Linear Models. 4th ed. Cary, NC, USA: SAS Institute; 2002.
50. Robbins KR, Saxton AM, Southern LL. Estimation of nutrient requirements using broken-line regression analysis. J Anim Sci. 2006;84 Suppl:E155–E165.
51. Kratzer FH, Vohra P. Chelates in Nutrition. Boca Raton, FL, USA: CRC Press; 1986.
52. Ashmead D. The need for chelated trace minerals. Vet Med Small Anim Clin. 1974;69:467–468.
53. Nitrayova S, Windisch W, von Heimendahl E, Muller A, Bartelt J. Bioavailability of zinc from different sources in pigs. J Anim Sci. 2012;90(Suppl 4):185–187.
54. Fly AD, Izquierdo OA, Lowry KR, Baker DH. Manganese bioavailability in a Mn-methionine chelate. Nutr Res. 1989;9:901–910.
55. Wedekind KJ, Lowry SR. Are organic zinc sources efficacious in puppies? J Nutr. 1998;128:2593S–2595S.
56. Yan F, Waldroup PW. Evaluation of Mintrex® manganese as a source of manganese for young broilers. Int J Poult Sci. 2006;5:708–713.
57. Schlegel P, Sauvant D, Jondreville C. Bioavailability of zinc sources and their interaction with phytates in broilers and piglets. Animal. 2013;7:47–59.
58. Jondreville C, Lescoat P, Magnin M, Feuerstein D, Gruenberg B, Nys Y. Sparing effect of microbial phytase on zinc supplementation in maize-soya-bean meal diets for chickens. Animal. 2007;1:804–811.
59. Dufner-Beattie J, Wang F, Kuo YM, Gitschier J, Eide D, Andrews GK. The acrodermatitis enteropathica gene ZIP4 encodes a tissue-specific, zinc- regulated zinc transporter in mice. J Biol Chem. 2003;278:33474–33481.
60. Eide DJ. The SLC39 family of metal ion transporters. Pflugers Arch. 2004;447:796–800.
61. Liuzzi JP, Cousins RJ. Mammalian zinc transporters. Annu Rev Nutr. 2004;24:151–172.
62. Cousins RJ, Liuzzi JP, Lichten LA. Mammalian zinc transport, trafficking, and signals. J Biol Chem. 2006;281:24085–24089.
63. Lilburn MS. Skeletal growth of commercial poultry species. Poult Sci. 1994;73:897–903.
64. Orth MW. The regulation of growth plate cartilage turnover. J Anim Sci. 1999;77 Suppl 2:183–189.
65. Julian RJ. Production and growth related disorders and other metabolic diseases of poultry – a review. Vet J. 2005;169:350–369.
66. Frantz NZ, Andrews GA, Tokach MD, et al. Effect of dietary nutrients on osteochondrosis lesions and cartilage properties in pigs. Am J Vet Res. 2008;69:617–624.
67. Ferket PR, Oviedo-Rondon EO, Mente PL, et al. Organic trace minerals and 25-hydroxycholecalciferol affect performance characteristics, leg abnormalities, and biomechanical properties of leg bones of turkeys. Poult Sci. 2009;88:118–131.
68. Manangi MK, Vazquez-Añon M, Richards JD, Carter S, Buresh RE, Christensen KD. Impact of feeding lower levels of chelated trace minerals vs industry levels of inorganic trace minerals on broiler performance, yield, foot pad health, and litter mineral concentration. J Appl Poult Res. 2012;21:881–890.
69. Chen J, Richards JD, Wedekind KJ, Manangi MK, Wideman RF, Dibner JJ. Effect of trace minerals on the development of bacterial chondronecrosis with osteomyelitis in poultry. Poster presentation at the Annual Meeting of the Poultry Science Association. July 14–17, 2014, Corpus Christi, TX, USA.
70. Wedekind KJ, Coverdale JA, Hampton TR, et al. Efficacy of an equine joint supplement, and the synergistic effect of its active ingredients (chelated trace minerals and natural eggshell membrane) as demonstrated in equine, swine, and an osteoarthritis rat model. Open Access Animal Physiology. 2015;7:13–27.
71. Dibner JJ, editor. Early nutrition of zinc and copper in chicks and poults: impact on growth and immune function. 3rd Mid-Atlantic Nutrition Conference. College Park, MD, USA: Maryland Feed Industry Council and University of Maryland; March 24, 2005.
72. Richards JD, Zhao J, Harrell RJ, Atwell CA, Dibner JJ. Trace mineral nutrition in poultry and swine. Asian Aust J Anim Sci. 2010;23:1527–1534.
73. Bun SD, Guo YM, Guo FC, Ji FJ, Cao H. Influence of organic zinc supplementation on the antioxidant status and immune responses of broilers challenged with Eimeria tenella. Poult Sci. 2011;90:1220–1226.
74. Sun Q, Guo Y, Ma S, Yuan J, An S, Li J. Dietary mineral sources altered lipid and antioxidant profiles in broiler breeders and posthatch growth of their offsprings. Biol Trace Elem Res. 2012;145:318–324.
75. Sun Q, Guo Y, Li J, Zhang T, Wen J. Effects of methionine hydroxy analog chelated Cu/Mn/Zn on laying performance, egg quality, enzyme activity and mineral retention of laying hens. J Poult Sci. 2012;49:20–25.
76. Hambidge KM, Casey CE, Krebs NF. Zinc. In: Mertz W, editor. Trace Elements in Human and Animal Nutrition. 1st ed. Orlando, FL, USA: Academic Press; 1986.
77. Mavromichalis I, Emmert JL, Aoyagi S, Baker DH. Chemical composition of whole body, tissues, and organs of young chickens (Gallus domesticus). J Food Comp Anal. 2000;13:799–807.
78. Wedekind KJ, Titgemeyer EC, Twardock AR, Baker DH. Phosphorus, but not calcium, affects manganese absorption and turnover in chicks. J Nutr. 1991;121:1776–1786.
79. Hand MS, Thatcher CD, Remillard RL, Roudebush P, editors. Small Animal Clinical Nutrition. 4th ed. Topeka, KS, USA: Mark Morris Institute; 2000.
80. Association of American Feed Control Officials. AAFCO 2015 Official Publication. Champaign, IL, USA: Association of American Feed Control Officials; 2015.
81. National Research Council (US), Ad Hoc Committee on Dog and Cat Nutrition. Minerals. In: Nutrient Requirements of Dogs and Cats. Washington, DC, USA: National Academies Press; 2006.
82. Robertson BT, Burns MJ. Zinc metabolism and the zinc-deficiency syndrome in the dog. Am J Vet Res. 1963;24:997–1002.
83. Sanecki RK, Corbin JE, Forbes RM. Tissue changes in dogs fed a zinc-deficient ration. Am J Vet Res. 1982;43:1642–1646.
84. Sanecki RK, Corbin JE, Forbes RM. Extracutaneous histologic changes accompanying zinc deficiency in pups. Am J Vet Res. 1985;46:2120–2123.
85. Lowe JA, Wiseman J, Cole DJ. Zinc source influences zinc retention in hair and hair growth in the dog. J Nutr. 1994;124:2575S–2576S.
86. Boling SD, Douglas MW, Johnson ML, et al. The effects of dietary available phosphorus levels and phytase on performance of young and older laying hens. Poult Sci. 2000;79:224–230.