


Implementing troubleshooting
Gaining as much feedback of the current problem beforehand can help focus management time and attention for a speedier response By:
By: First week mortality problem
No point in investigating the egg quality, incubators or hatchers straight away, as the chicks have successfully hatched. Start looking at the chick processing areas and chick quality:
- Culling/grading – Do not send out poor quality chicks to the broiler farms. Check the quality of chicks in the boxes in the chick holding room.
- Any stress factors – chilling, overheating, draughts or stressed chicks in under-ventilated areas. Listen and Observe – the chicks signal if they are distressed by being noisy, panting, huddling or trying to poke their heads through the sides of the chick boxes.
- Signs of dehydration (leg veins protruding, extended wing feathers or heavy meconium levels on eggshells). Low chick yield percentage (65% and below) with no yolk present when palpating the abdomen of the chick.
- Smell – no obvious signs of omphalitis/yolk sac infection from floor eggs, bangers or dirty eggs.
- Bacterial infection – high chick yield percentage (69%+). Palpating the abdomen of the chick can indicate if too much residual yolk is present (full bellies), which can be a source of infection especially if the chicks were exposed to stress factors, bringing on secondary infections.
- Cloaca temperatures –a good tool to indicate if the chicks have been stressed. (should be 40.0 to 40.6 °C).
- Check the vehicle before loading – is the inside of the box dry and pre-warmed ready for loading chicks? Are the fans switched on during loading to provide ventilation?
Recent decline in performance
- What’s changed? – Nutrition, disease status, vaccination programmes, chemical supplier, personnel, etc
- Have all the flocks been affected or just one or two?
- Do the problems occur on all hatch days or just one or two?
- Where do the losses occur? – is it infertility, early dead, mid-term losses or late dead losses.
- Maintenance – any recent breakdowns/installations? – ventilation systems, boilers, chillers or chick counters (are they counting correctly)?
- Climate – is hot weather causing early dead losses from pre-incubated eggs on farms?
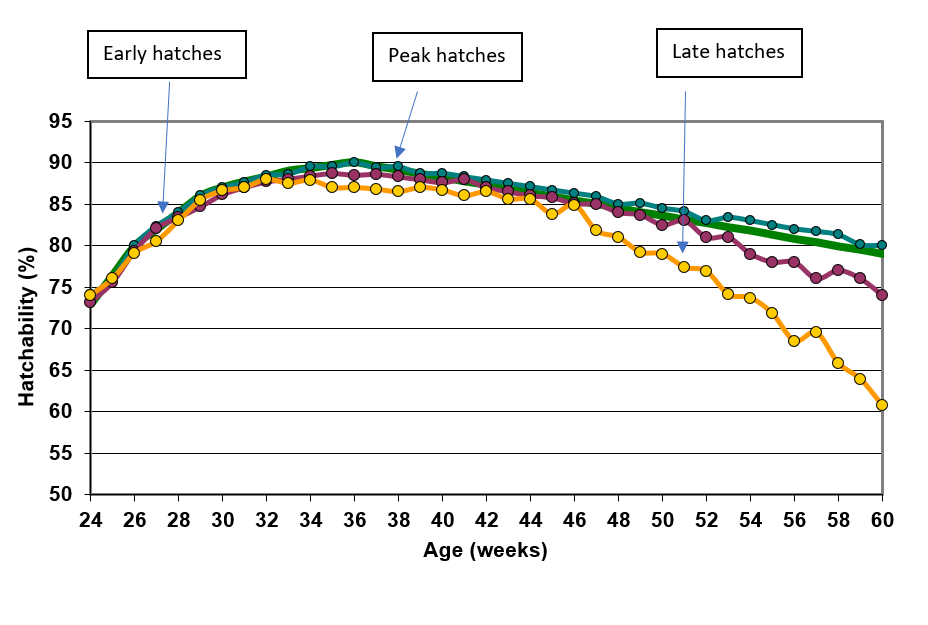
Overall performance is continuously below standard
First, know where your losses are and what the contributing factors are.
The yellow line is typical of under-performing hatcheries – hatchability starts off well but does not achieve peak levels and then falls away too fast from the weekly target.
Key focal points for investigating hatchability problems – In no specific order of priority.
- Performance history/data capture
- Embryo diagnosis (10-day and hatch debris)
- Incoming egg quality
- Egg storage
- Incubator operation
- Transfer operation
- Hatcher operation
- Chick quality (including chick processing and holding)
- Ventilation
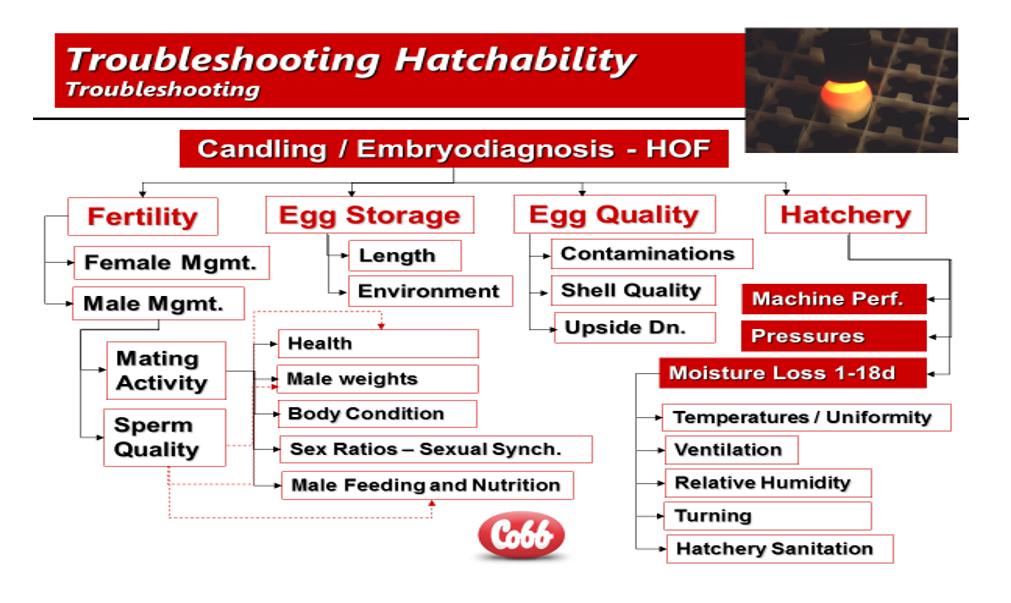
There are many areas or conditions that can affect hatchability levels and the troubleshooting process helps to identify or eliminate symptoms of the cause (see diagram below).
Is hatchability affected at specific stages during the flock cycle (ie. young flocks, peak or older flocks)?. See graph below.
1. Performance history/data capture
More often than not, hatcheries tend to have some ‘rogue’ incubators. Either they are at the end of the chilled water supply line, located on external walls, next to doorways or closest to air extraction units, etc.
The point is that we need to measure performance to know if problem hatches may be related to certain incubators.
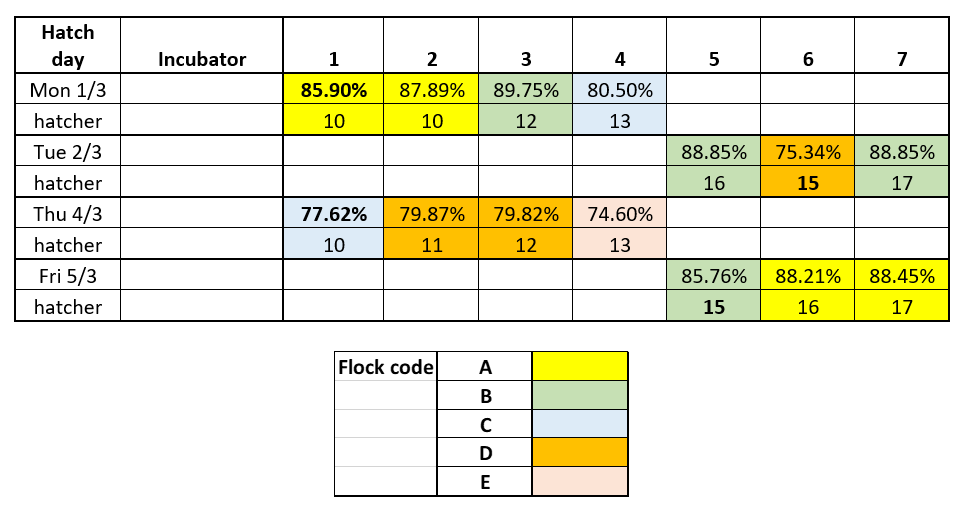
Keeping records of problem hatches and tracing them to see if they correlate with individual incubators or hatchers can help resolve problems quicker.
2. Embryo diagnosis (10 day and hatch debris)
will highlight positive and adverse areas to target and help focus the investigative direction
Keep it simple by following the Cobb recommendations of breaking the analysis down to 4 specific areas:
- Infertile
- Early dead (0 to 7 days)
- Mid-term (8 to 14 days)
- Late dead (15 to 21 days)
This subject is covered in more detail in the ‘Embryodiagnosis’ poster in the HATCHIEVES series.
Hatcheries cannot hatch infertile eggs.
3. Incoming egg quality
Refer to HATCHIEVES series – ‘Egg Quality’.
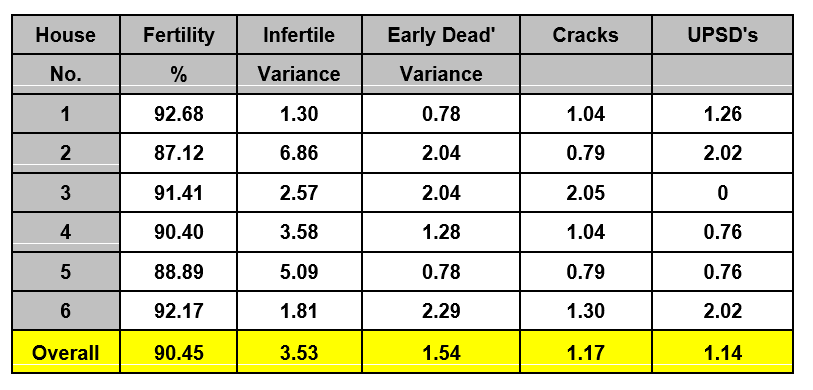
- Far too often, too many reject eggs (cracks and upside-down eggs) are incubated in the hatchery resulting in lower performance levels. Control incoming egg quality. It may be a company decision to use these eggs, but at least be aware of what is arriving and their impact on the hatchability levels.
The table below shows an example of where fertility is in relation to target for age and the impact of cracks and upside-down (UPSD) eggs coming into the hatchery.
- Egg disinfection –incorrect applications (either using formalin or chemicals) can cause damage to the blastodisc.
- Washing eggs – increase the risk of contamination.
4. Egg storage
- Prevent temperature variations (eggs sweating).
- Maintain below physiological zero (24°C – temperature at which embryo development ceases).
- Keep spaces between trolleys or boxes of eggs to assist with cooling.
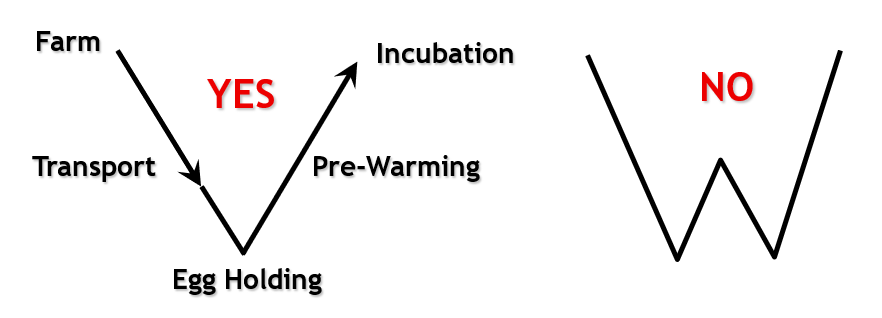
- Maintain the ‘V’ profile (as seen in the diagram below) with the hatchery egg store being the lowest point for temperature.
5. Incubators –
Observe for:
- Temperature (calibration, eggshell temperatures)
- Humidity (sprays leaking, moisture loss)
- Turning angles (frequency, desired angles in both directions)
- Ventilation (air volumes, CO2 levels, damper calibrations)
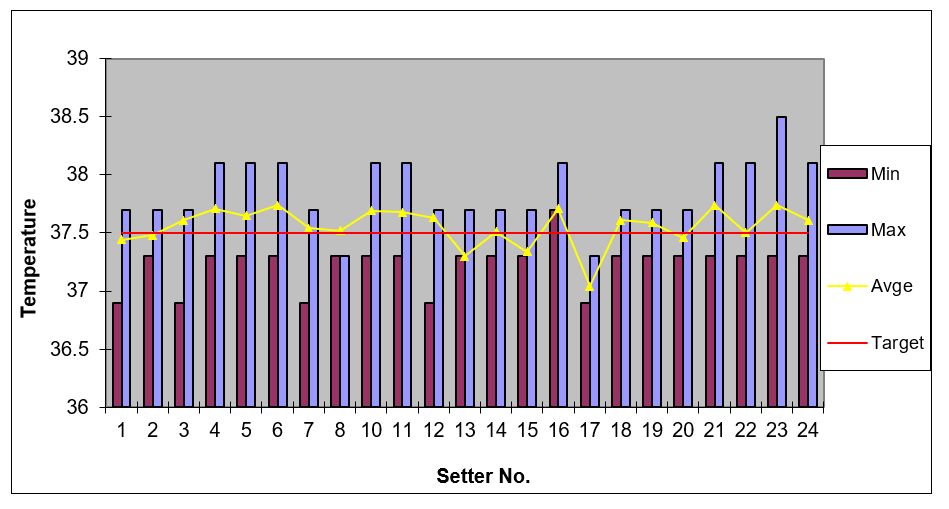
The following graph shows 24 multi-stage incubators in a hatchery monitored individually over a period of a week using temperature loggers to record the minimum, maximum and average temperatures of each incubator to the target temperature of 37.5°C. You can clearly see that some incubators are averaging far too high a temperature, whilst incubators 13, 15 and 17 are all running too low resulting in delayed hatches and reduced hatchability levels.
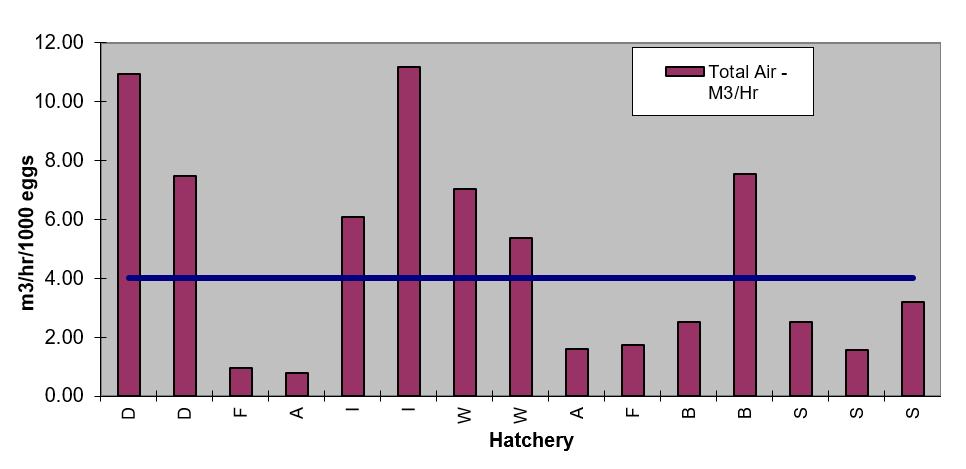
Another scenario where the air volumes to each incubator room in a company with several hatcheries was measured. The letter in the horizontal scale indicates the hatchery and individual incubator room (ie. hatchery S has 3 setter rooms).
The variation is huge and more alarmingly that several of these incubator rooms do not meet the target set at 4 m³/hr/1000 eggs.
6. Transfer operation –
Observe for:
- Transfer damage
- Wet baskets and/or hatchers
- Too many trolleys waiting in the corridor/transfer room awaiting transfer.
- Egg trolleys kept in incubator corridors for long periods of time – risk of overheating, spray nozzles leaking onto eggs, lack of air movement (ventilation) to other eggs in the incubator.
7. Hatcher operation –
- Check calibrations – temperature, alarms, humidity and dampers.
- Prevent high humidity levels directly after transfer.
- Use a ‘step-down’ profile for temperature to prevent overheating of the chicks.
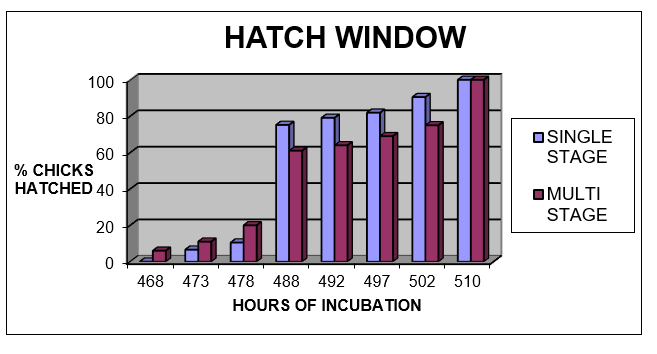
- Monitor hatch windows to optimize incubation times.
- Ensure fumigation pans are not dry before pipping/hatching of chicks.
- Uniform hatching between baskets.
8. Chick quality –
- Check correct incubation times – low chick numbers due to late hatching (low temperatures, insufficient incubation time, etc).
- Too many culls or dead chicks in the baskets (overheating, poor turning angles in the incubator, high humidity levels or lack of ventilation).
- Poor environmental conditions – stress from chilling, overheating, draughts or lack of ventilation. Wet boxes for chicks.
- Inaccuracy of equipment – need to check operation of vaccination, chick counters or automatic chick separators and waste vacuum systems.
- Damage through equipment – pinch points, broken boxes or baskets and smooth conveyors/belts causing leg damage.
- Chick yield percentage and cloaca temperatures.
9. Ventilation
Already covered in some areas above, but also refer to the Ventilation poster in the HATCHIEVES series.
Summary –
- Know where your losses are
- Identify the ‘low hanging fruit’ – the easiest and quickest gains to make.
- Maximise the efficiency of the incubators –
- temperature control
- turning angles
- calibrations
- remove excess humidity
- setting patterns
- moisture loss (11-13%)
- ventilation
- Chick Quality –
- chick yield (66%-68%)
- chick holding conditions
- remove stress factors
- cloaca temperatures (40.0°C – 40.6°C)
- transport
- Hatch Window –
- flock ages
- seasonal effects
- chicks not too fresh for local deliveries

 28 May 2025
 2
minute read
2
minute read