Insights from your breeder flocks through data analysis
 4 May 2022
 5 minute read
 By:
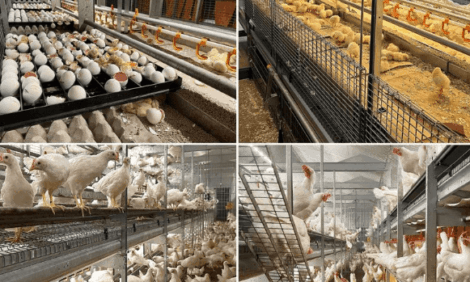
By: Breeder Flock Data Collection
Developing strains of meat type poultry with a balance of broiler and breeder performance traits is the goal of a primary breeder company. To evaluate genetic progress, breeder populations and their progeny are continuously being tested. Accumulated data serves as the basis for selection decisions designed to maximize progress in the desired traits for future generations of chickens. The results are often considered to represent the genetic potential of a pure line or commercial product cross. Customers around the world use the genetic potential as their performance target. In the field, performance results of commercial flocks can vary largely due to environmental conditions. Sources of environmental variation include, but are not limited to location, housing configuration, equipment, management programs, feed formulations, vaccination schedule and disease challenge. Therefore, the collection of flock data is important for breeder managers to better understand the true performance and potential under their conditions. Successful collection of flock performance data will support the goals of the broiler and processing divisions. Databases should be developed to record production results on an individual flock basis.
Accurate data analysis in a timely manner is the key to acquiring knowledge and insights of breeder flocks. Main metrics for a completed flock may include:
- Number of females placed, capitalized (at 5 % hen day production), and sold at the end of production.
- Age at capitalization
- Cumulative amount of feed consumed up to capitalization
- Cumulative amount of feed consumed to produce a hatching egg
- Total number of eggs per hen housed
- Total number of hatching eggs per hen housed
- Life of flock (LOF) fertility and hatchability
- LOF hen mortality
- Total number of chicks per hen housed
Ranking Flocks
The relative success of a completed flock can be evaluated based on a variety of parameters. The most common hen performance indicator is total eggs per hen housed (TE/HH). Hatching eggs per hen housed (HE/HH) can also be used but consider that there might be different egg sort criteria placed on cull (or unqualified) eggs for different operations. The LOF fertility data provided by the hatchery represents the male condition and field performance. Chicks per hen housed (Chicks/HH) is a good parameter to show combined flock performance of the females and males.
It is also important to see how your completed flock compared to average flock performance of comparable products in your region. To make this comparison, pick a group of good performing flocks (top 25 % of all flocks), and a group of sub-optimal performers (bottom 25 %). All the management related programs, including body weight, feed intake, flock uniformity, density, feeder space, vaccination schedules, and photo stimulation programs should be grouped together when calculating the performance. Breeder managers can carefully review the data, evaluate the discrepancies, and make decisions that will better prepare producers to maximize genetic potential for future flocks.
Since genetic progress is ongoing, ranking of breeder flocks is an ongoing process that should be done every 6 or 12 months. Through meaningful comparisons, top flocks can give the breeder manager an idea of better programs or practices to follow. Bottom flocks, on the other hand, indicate what practices should be adjusted. Meaningful differences found in top and bottom flocks can assist decision makers to optimize management recommendations that can benefit current and future flocks.
Insights from Flocks
Comparing data from the top 25 % and bottom 25 % flocks with your flock data will allow detailed analysis of your flock from different perspectives. It is often assumed that farms with better performance are better managed and vice versa. Flock data compilation blends the best flocks’ weights, feeding, and light programs while removing farm management differences to uncover the factors responsible for the better results. Factors to explore for broiler breeders should include:
- Energy and protein intake per bird from rearing to flock transfer. This should be recorded at least at 4 and 20 weeks of age.
- Whether the birds are graded for weight or body condition (breast conformation), and the grading age and procedure applied.
- Weekly weight curves, with emphasis on ages where weight gain is critical for skeletal and reproductive development.
- Feed allocations, amount of each feed increase, strategy for feed withdrawal if necessary.
- Day length and light intensity in rearing and production, evaluation of the timing of photo stimulation and how this corresponds with body weights and feeding.
An example of egg production from a company is graphed (Figure 1).
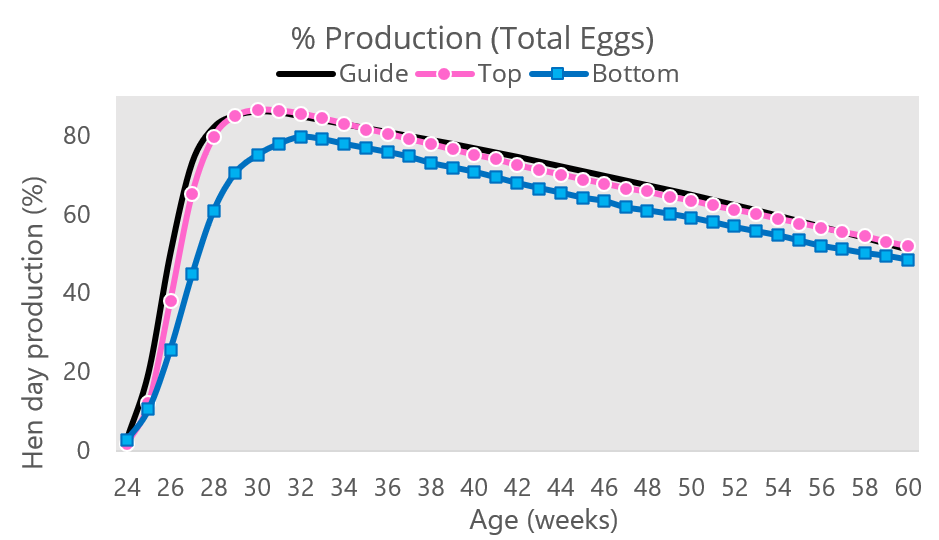
Top flocks performed generally close to standard while bottom flocks were below production expectations. When taking a closer look at the female weight in rearing (Figure 2), it became clear that the average weight of bottom producing flocks was below standard from 10 weeks to photo stimulation.
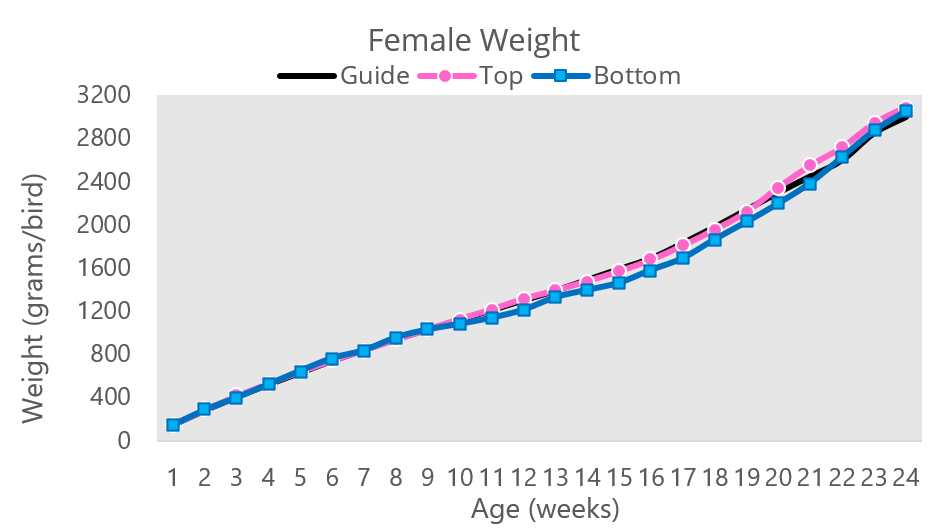
This slowed growth could have resulted in reduced skeletal frame and poor condition associated with insufficient fleshing and fat deposition at the time of photo stimulation. To determine the cause of the lighter weight profile, feed intake was reviewed (Figure 3).
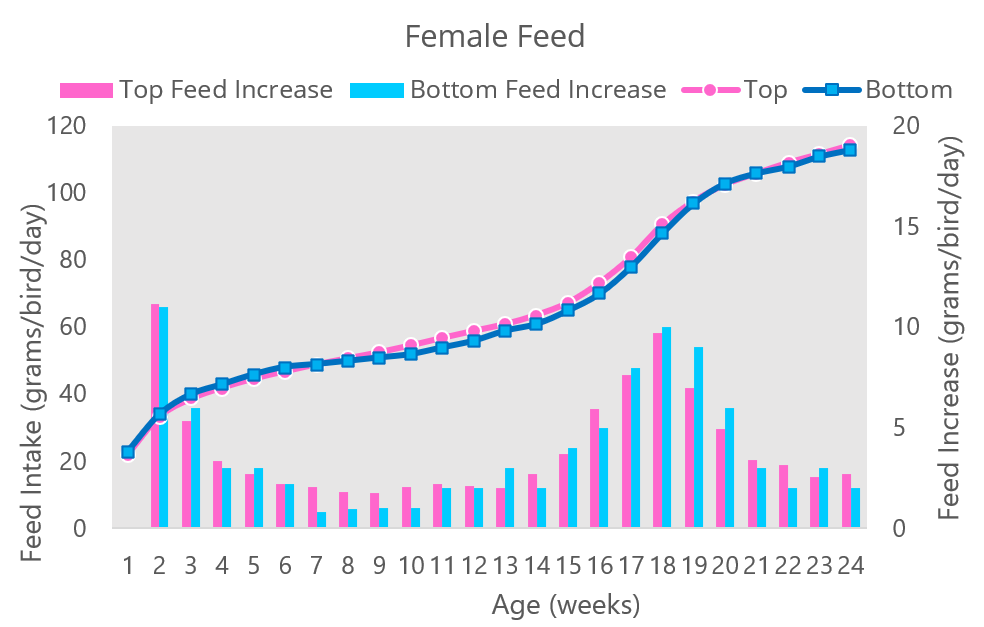
It appears that lower feed amounts were observed, which led to insufficient nutritional consumption. Future flocks can be improved overall by assuring that feed pattern is consistent with that recommended in our product supplements (available at Cobb-Vantress.com). This is one example of how flock data can be used to troubleshoot. Many other analysis and correlations can be created to help identify the areas to focus for the breeder farms.
Building Trends
Another great benefit of complete and accurate data collection is the opportunity to establish parameter trends that will help you understand the flock response to management changes. This flock overview can be on a yearly, quarterly, or even monthly basis. With increased data volume plotted in the model, better predictions can be made. The more data included, the more reliable the trends are.
Always focus on data quality and volume. Let the data tell you what is happening with your flocks. Use the data as a tool to address your concerns. When you summarize and study flock performance data from top and bottom flocks in your region, you will find valuable information that will allow you to adjust management practices and can help achieve the full genetic potential of the product. When you study performance trends for your farm you will better understand the impact that management change. In depth flock analysis should be the foundation of decision making for your operation.