

More European Layers in Alternative Housing Systems
The latest figures for the EU laying flock reveal a gradual move to alternative (non-battery cage) housing systems between 2008 and 2009 but 100 million birds may still be in conventional cages when the EU ban comes into force in January 2012, writes Terry Evans exclusively for ThePoultrySite.Of the nearly 358 million layers in the European Union last year, some 253.1 million or almost 71 per cent were kept in cages, down from 264.0 million and 74.4 per cent in the previous year. However, these figures include those kept in enriched cages.
Informed guesses put the number that will likely still be housed in conventional battery cages at the start of 2012 – when no birds are supposed to be kept in this manner – at as much as 100 million birds!
Total layer numbers rose slightly between 2008 and 2009 (see table 1), with more than 50 per cent of the EU flock found in just four countries – Italy, France, Spain and Germany.
| Table 1. Number of layers in the EU (millions and percentage) | ||||
|---|---|---|---|---|
| Country | 2008 | 2009 | ||
| millions | % | millions | % | |
| Italy | 49.7 | 14.0 | 46.6 | 13.1 |
| France | 44.2 | 12.5 | 46.0 | 13.0 |
| Spain | 46.3 | 13.1 | 44.0 | 12.4 |
| Germany | 45.5 | 12.8 | 43.3 | 12.2 |
| UK | 34.3 | 9.7 | 37.1 | 10.5 |
| Poland | 33.9 | 9.6 | 33.9 | 9.6 |
| Netherlands | 31.0 | 8.7 | 31.8 | 9.0 |
| Belgium | 9.1 | 2.6 | 8.8 | 2.5 |
| Others | 60.7 | 17.1 | 66.1 | 18.6 |
| EU | 354.7 | 100.0 | 357.6 | 100.0 |
| Source: EC/PVE | ||||
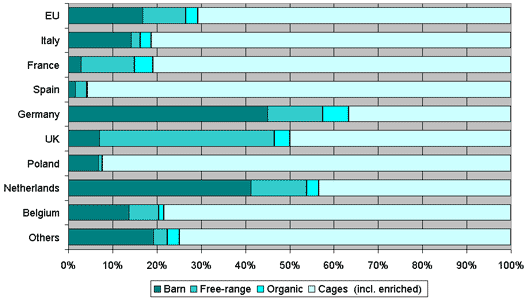
Between 2008 and 2009, all the alternative systems to cages recorded increases in bird numbers and also in the proportion of the EU flock, as the total rose from fewer than 91 million to more than 104 million. Hence, the percentage of the EU flock housed in alternatives to cages went up from 25.6 per cent to 29.2 per cent.
Germany with 19.5 million and the Netherlands with 13.1 million had the largest number of birds in barns, these representing 45.0 per cent and 41.2 per cent of the national flocks, respectively. For the EU, the percentage housed in this way went up from 14.3 to 16.8.
Nearly 15 million birds – or a massive 39.6 per cent of all layers in the UK – were on free-range, which contrasted with the overall figure for the EU of 34.8 million or just 9.7 per cent.
Although there has been an increase in layers kept under an organic system the proportions of the total nationally are small and for the EU less than three per cent.
| Table 2. Number of layers according to management system in the EU (millions) | ||||||||||
|---|---|---|---|---|---|---|---|---|---|---|
| Country | Barn | Free-range | Organic | Total alternatives | Cages (incl. enriched) |
|||||
| 2008 | 2009 | 2008 | 2009 | 2008 | 2009 | 2008 | 2009 | 2008 | 2009 | |
| Italy | 8.2 | 6.6 | 0.6 | 1.0 | 1.0 | 1.1 | 9.8 | 8.7 | 39.9 | 37.9 |
| France | 1.3 | 1.3 | 5.4 | 5.6 | 1.5 | 1.9 | 8.2 | 8.8 | 36.0 | 37.2 |
| Spain | 0.7 | 0.7 | 0.5 | 1.1 | 0.1 | 0.1 | 1.3 | 1.9 | 45.0 | 42.1 |
| Germany | 9.7 | 19.5 | 5.8 | 5.4 | 2.5 | 2.5 | 18.0 | 27.4 | 27.5 | 15.9 |
| UK | 2.6 | 2.6 | 12.3 | 14.7 | 1.5 | 1.3 | 16.4 | 18.6 | 17.9 | 18.5 |
| Poland | 1.8 | 2.3 | 0.1 | 0.3 | 0.0 | 0.0 | 1.9 | 2.6 | 32.0 | 31.3 |
| Netherlands | 12.6 | 13.1 | 3.7 | 4.0 | 0.8 | 0.9 | 17.1 | 18.0 | 13.9 | 13.8 |
| Belgium | 1.0 | 1.2 | 0.5 | 0.6 | 0.1 | 0.1 | 1.6 | 1.9 | 7.5 | 6.9 |
| Others | 12.7 | 12.7 | 2.5 | 2.1 | 1.2 | 1.8 | 16.4 | 16.6 | 44.3 | 49.5 |
| EU | 60.6 | 60.0 | 31.4 | 34.8 | 8.7 | 9.7 | 90.7 | 104.5 | 264.0 | 253.1 |
| Source: EC/PVE | ||||||||||

November 2010


