


Nigeria Soybeans and Products Report
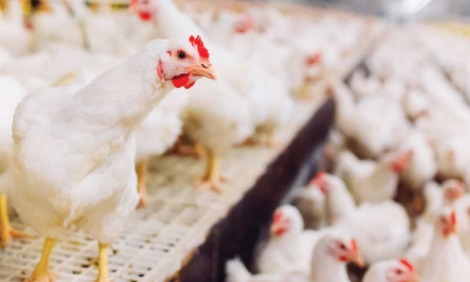
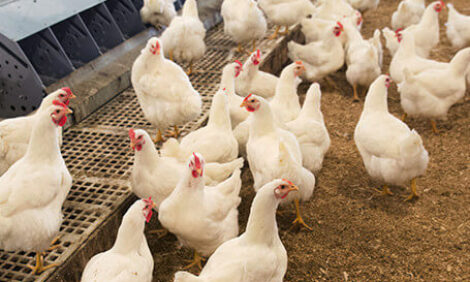
Nigeria's domestic production of soybeans is trending upwards, but still lags behind the rapidly growing demand from the poultry industry for soy meal and vegetable oil processors, according to the USDA Foreign Agricultural Service. By:
By: Production:
Nigeria’s soybean output is forecast to increase to 510,000 MT in 2011/12, up from 480,000 MT in 2010/11. The increase in output is attributed to favorable weather in Nigeria’s soybeans production belt. Compared to the erratic pattern in 2010, rainfall was favorable both in terms of volume and distribution in 2011. Also, acreage increased because of the prevailing attractive prices. The estimates are based on available government data and field visits to Nigeria’s soybeans production belt. (Note that production estimates used in this report include output used at farmer’s household level).
Despite this steady increase, domestic output continues to lag behind rising demand. Higher production is constrained by low yield levels resulting from the high cost of seeds and scarcity of superphosphate fertilizers. Average yield levels are approximately 1.2 MT/ha. Soybeans are produced on smallholder farms averaging no more than one hectare or 2.47 acres; as a result it is non-mechanized. In Nigeria soybean cultivation starts in May/June with land clearing, and harvesting normally occurs in late October through November every year. The crop is harvested 3 - 4 months after planting, depending on the time of sowing and seed variety. Benue State is the dominant soybean producing area but several other states, such as Kaduna, Plateau, and Nassarawa are increasing production.
Malnutrition is endemic in Nigeria and soybeans are a near-perfect crop to address the problem. Soybeans are affordable as they cost only one-fifth of the price of beef and poultry yet carry twice the protein as these animal products and also offer essential amino acids. Soybeans are also good for the environment because they require fewer insecticide sprays. They also fix atmospheric nitrogen and thus reduce fertilizer used by farmers.
Consumption:
| SOYBEAN USE 2007/08 | QUANTITY | PERCENTAGE |
|---|---|---|
| Crush + full fat soy | 255,000 | 53 |
| Industrial Food use | 29,000 | 6 |
| Direct human Consump.+ seed + Residuals | 200,000 | 41 |
| Total | 200,000 | 41 |
Crush: Nigeria’s installed annual soybean crushing capacity is estimated at approximately 600,000 MT. An estimated 255,000 tons of soybeans were crushed in MY2010/11, representing only 42 percent of installed processing capacity. Eight large processors account for nearly 60 percent of Nigeria’s soybean crushing industry. Industry sources forecast crushing to rise to 271,000 tons in MY2011/12 on account of the anticipated increased soybeans production. Soybeans are crushed to obtain oil (for industrial and refined for food use) and soybean meal/cake for animal feed. At present, soybean oil is a major complement to palm oil in the domestic supply equation for edible vegetable oils and the major producers have reported a rise in demand for soybean oil as Nigerians became more familiar with the higher quality and health benefits of soybean oil. Although palm and soybean oil are produced in
Nigeria, domestic production of these vegetable oils has not kept pace with rising demand. There is an annual shortfall of approximately 300,000 tons. Beginning in September 2008, the Government of Nigeria (GON) removed the import ban on crude vegetable oil and imports are trending upwards. Note that imports of all vegetable oil in retail packs remain banned. Field visits to the soybean production belt revealed that a few new small scale crushing facilities have been established in the last two years.
Soybean meal is the dominant and preferred protein ingredient in poultry feed rations. Prices of soybean meal surged to a high of $775 a ton in 2011, up from $485 last year. In ideal situations, poultry producers would prefer soybean meal inclusion rate of 30 percent in compound their feed, but the scarcity and high cost of the product have forced them to reformulate in favor of low quality substitutes such as peanut cake, cottonseed, and palm kernel meal.
Industrial Use: Leading infant food manufacturers in the country use soybeans because of its high nutritional value. Soybeans are also processed into flour and soybean oil is used in the local paint, cosmetics, and soap making industries.
Household: Direct human consumption of soybeans is significant in Nigeria, especially among rural low-income groups that cannot really afford animal protein sources such as meat, fish and eggs. Beginning in the early 1990s, the International Institute of Tropical Agriculture (IITA) promoted the use of protein-rich soybeans in everyday foods to curb malnutrition. IITA estimates the cost of protein, when purchased as soybeans, to be only about 10 - 20% of the cost of protein from meat, eggs, fish or
milk. Soybeans are now widely consumed and are readily used in the production of soymilk, soy cake, soy yogurt and the fortification of local carbohydrate-based Nigerian food staples. Dawadawa, a local food seasoning, is also produced from soybeans. Government sources estimate that about 41 percent of Nigeria’s domestic production is consumed directly in rural areas as human food. (Note that residuals of disappearances not accounted for in industrial use are included here).
Prices
The price of soybean meal increased to a high $775 per ton in October 2011, up from $484 per ton the same time last year (see table below). The increase in price is attributed to excess demand over domestic output.
Price Table
| Soybeans N/Ton | Soybean Meal N/Ton | Layer Feed N/Ton | |
|---|---|---|---|
| October 2010 | 72,000.00 | 75,000.00 | 77,600.00 |
| November | 65,000.00 | 68,000.00 | 77,600.00 |
| December | 65,000.00 | 68,000.00 | 77,600.00 |
| January 2011 | 70,000.00 | 75,000.00 | 77,600.00 |
| February | 72,000.00 | 78,000.00 | 77,600.00 |
| March | 90,000.00 | 93,000.00 | 77,600.00 |
| April | 100,000.00 | 105,000.00 | 80,000.00 |
| May | 110,000.00 | 112,000.00 | 84,800.00 |
| June | 110,000.00 | 112,000.00 | 84,800.00 |
| July | 110,000.00 | 112,000.00 | 84,800.00 |
| August | 115,000.00 | 120,000.00 | 91,200.00 |
| September | 115,000.00 | 120,000.00 | 91,200.00 |
| October 2011 | 115,000.00 | 120,000.00 | 91,200.00 |
Trade:
Nigeria has been steadily importing soybean meal and occasionally soybeans since 1999, primarily from Argentina and the United States. Based upon Post’s survey of the feed industry, it is estimated that Nigeria would require soybean meal imports of approximately 100,000 MT annually. The import duty on soybeans and soybean meal for animal feed is 15 percent.
Marketing:
Feed millers in Nigeria are familiar with the higher quality of U.S. soybean meal, especially with protein levels exceeding those commonly seen for products from other countries. Market opportunities of about 100,000 MT of soybean meal exist for U.S. exporters. Additionally, importers and vegetable oil refinery companies are taking advantage of the removal of the import ban to import.
U.S. soybean, soybean meal and crude vegetable oil exporters are encouraged to explore these growing
market opportunities in Nigeria. The Office of Agricultural Affairs can be contacted to identify credible
Nigerian importers. In addition, exporters can also arrange to meet with leaders of the Nigerian poultry industry at the annual International Poultry Exposition in Atlanta.
Recent market development activities in Nigeria by the American Soybean Association’s World Initiative for Soy in Human Health (WISHH) have generated enormous interest in value-added soy products and soy-based food ingredients. Food processors such as bakeries, dairies, beverage manufactures and snack producers are now incorporating soy products in their production processes largely on account of the nutritional and health benefits and cost effectiveness as protein substitutes and extenders. Best market prospects in this segment include: soy flour used to fortify other foods (bakeries), textured soy protein used as protein substitute in snacks and soups, soy protein concentrates used as an additive in foods and beverages, and soy protein isolates used as food improver.
Production, Supply and Demand Data Statistics:
| Oilseed, Soybean Nigeria | 2009/2010 | 2010/2011 | 2011/2012 | |||
|---|---|---|---|---|---|---|
| Market Year Begin: Oct 2009 | Market Year Begin: Oct 2010 | Market Year Begin: May 2011 | ||||
| USDA Official | New Post | USDA Official | New Post | USDA Official | New Post | |
| Area Planted | 440 | 440 | 440 | 440 | 440 | 445 |
| Area Harvested | 440 | 440 | 440 | 440 | 440 | 445 |
| Beginning Stocks | 0 | 0 | 0 | 10 | 0 | 10 |
| Production | 450 | 460 | 450 | 480 | 450 | 510 |
| MY Imports | 4 | 4 | 4 | 4 | 4 | 10 |
| MY Imp. from U.S. | 0 | 0 | 0 | 0 | 0 | 0 |
| MY Imp. from EU | 0 | 0 | 0 | 0 | 0 | 0 |
| Total Supply | 454 | 464 | 454 | 494 | 454 | 530 |
| MY Exports | 0 | 0 | 0 | 0 | 0 | 0 |
| MY Exp. to EU | 0 | 0 | 0 | 0 | 0 | 0 |
| Crush | 228 | 228 | 228 | 255 | 228 | 271 |
| Food Use Dom. Cons. | 200 | 200 | 200 | 200 | 200 | 218 |
| Feed Waste Dom. Cons. | 26 | 26 | 26 | 29 | 26 | 31 |
| Total Dom. Cons. | 454 | 454 | 454 | 484 | 454 | 520 |
| Ending Stocks | 0 | 10 | 0 | 10 | 0 | 10 |
| Total Distribution | 454 | 464 | 454 | 494 | 454 | 530 |
| 1000 HA, 1000 MT | ||||||
November
Further Reading
| - | You can view the full report by clicking here. |
 1 June 2026
 3
minute read
3
minute read
 1 June 2026
1
minute read
1 June 2026
1
minute read