Poultry Litter Production and Associated Challenges
The University of Arkansas has monitored the frequency and weight of litter removed from its Applied Broiler Research Farm (ABRF) for 98 flocks since 1992. The figures reveal that caked litter removed varies considerably from one year to another. G.T. Tabler, Y. Liang and K.W. Van Devender report the results in the University's Avian Advice. 22 November 2009
 7 minute read
Introduction
Agricultural production and processing is big business in Arkansas. A recently released study by the University of Arkansas’ Division of Agriculture indicates that in 2007, agriculture accounted for one in six jobs in the state and $9.16 billion in labour income – more than 15 per cent of the state total.
Poultry and egg production and processing is the leading industry, with direct impacts of one in every four agricultural jobs and $1 in every $4 in agricultural wages and income. Production of poultry is more heavily concentrated now than in years past in terms of intensity of production, that is, more birds being grown and processed in the same geographic areas as in the past. The result of this increased production activity is larger quantities of poultry litter production. Because of benefits it provides (crop nutrients, increased organic matter), the majority of this poultry litter is, in some form, applied to the land. Although innovative utilisation methods continue to appear, land application remains the current standard.
In 2003, the Arkansas General Assembly passed three companion acts addressing nutrient planner and applicant certification (Act 1059), registration of poultry operations (Act 1060) and application of nutrient and utilisation of poultry litter in nutrient surplus areas (Act 1061). Detailed explanations of these acts are contained in the University of Arkansas Cooperative Extension Service Fact Sheet FSA29 New Arkansas Laws Regulate the Use and Management of Poultry Litter and Other Nutrients published in September 2003.
A significant portion of Act 1061 addresses development and implementation of nutrient management and poultry litter management plans for poultry feeding operations (grow-out farms). Poultry litter management planners shall have obtained certification from Arkansas Soil and Water Conservation Commission (now Arkansas Natural Resources Commission, ANRC) in planning. The poultry litter management plan shall contain: a periodic poultry litter nutrient content analysis component; poultry litter utilisation component providing for the proper utilisation of the litter produced, including provisions ensuring that land application within a nutrient surplus area is in accordance with a nutrient management plan or at a rate not to exceed the protective rate; land application outside a nutrient surplus area is in a method and at a rate acceptable to ANRC; and litter not land applied is converted to a nonnutrient use or other use acceptable to ANRC; and a records component that requires the poultry feeding operation owner to maintain sufficient records at the feeding operation to determine poultry litter utilisation and compliance with the other portions of the poultry litter management plan.
So, it is necessary that producer operations abide by rules and follow best management practices. Extension personnel can assist agricultural producers in adopting practices and behaviors to help meet their needs, one of which is to determine the amount of poultry litter their operation will likely generate in any given year.
University Farm Litter Production
The Applied Broiler Research Farm (ABRF) at Savoy has been used to develop and evaluate management practices and innovative approaches that may improve industry results. The ABRF had grown 98 flocks of birds through June 2008. To assist producers by sharing experiences with litter produced on the ABRF, detailed records that have been kept on litter removal during total cleanouts and caked litter (de-cake) removal between flocks since the farm began operating were assessed. Table 1 lists yearly caked litter removal at the ABRF. Removal ranged from a low of 31 loads in 1992 to a high of 173 loads in 2002. During the period, a total of 1,459 loads of de-cake were removed by a standard poultry house de-caker pulled behind a tractor with each load containing approximately 2 tons of de-cake. The 1,459 loads at 2 tons per load amounted to 2,918 tons of de-cake or 30 per cent of the total litter removed.
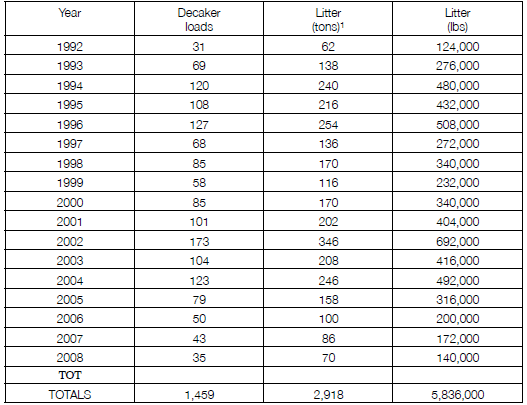
1Tonnage based on 2 tons per decaker load as determined by portable scales
Litter removal during total cleanouts is listed in Table 2. There were three periods when the farm was not on an annual clean-out schedule. During the first period, House 1 was not cleaned out from September 1996 to February 2000 and houses 2, 3 and 4 were not cleaned from October 1997 to February, 2000 due to ongoing research. During the second period, the houses were not cleaned from October 2001 to April 2003 to cycle back to a spring clean-out schedule. Finally, the houses were not cleaned out in 2007 due to a bedding material shortage. There were two clean-outs in 2005: one in April and another in September when the farm underwent renovations. Clean-out totals ranged from a low of 264 tons in September 2005 to a high of 875 tons in June 2008. During the period, a total of 6,864 tons of litter were removed at clean-out or 70 per cent of the total. A combined total of 9,782 tons of litter and de-cake had been removed from the ABRF through June 2008. This resulted in the following yearly and per-flock litter production information:
9,782 tons/18 yrs = 543 tons per yr/4 houses = 135.87 tons/ house/yr
or
9,782 tons/98 flocks = 99.82 tons/flock for the farm = 24.96 tons/house/flock
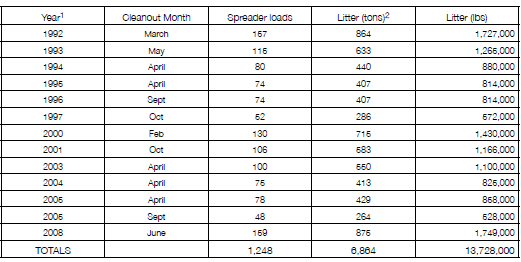
1Total clean-outs were not always performed on an annual basis
2Tonnage based on 5.5 tons per spreader truck load as determined by portable scales
The four houses at the ABRF are 40 × 400’ (16,000 sq. ft. floor space). Pounds of litter generated per square foot of floor space can be calculated as follows:
135.87 tons of litter per house per year × 2000 lbs per ton = 271,740 lbs litter per house per year/16,000 sq ft = 16.98 lbs litter per square foot of floor space per year
Pounds of litter produced on a per bird basis can also be estimated. If the total weight of litter produced (Tables 1 and 2) are divided by either head placed or head sold (Table 3), the pounds of litter per bird can be calculated. The 9,782 total tons of litter removed from the farm converts to 19,564,000 lbs. During the 18-year period, there were a total of 8,165,941 birds placed on the farm and 7,759,295 birds harvested. Based on these figures:
19,564,000 lbs /8,165,941 birds placed = 2.396 lbs litter per bird placed
or
19,564,000 lbs /7,759,295 birds harvested = 2.521 lbs litter per bird harvested
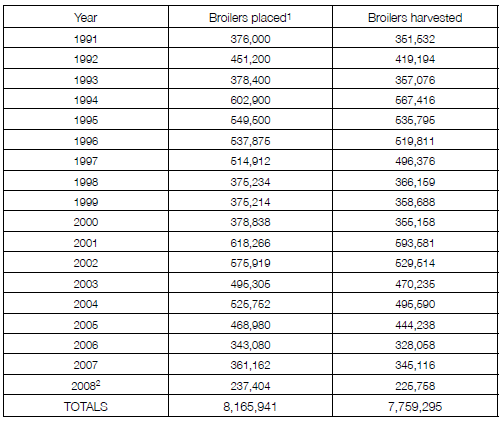
1Placements varied based on harvest age and number of flocks per year
2Placements include birds placed and harvested between Jan and June 2008
Litter production figures can vary greatly from farm to farm based on house size, bird harvest weight, management practices, number of flocks per year, etc.
Reference
Goodwin, Jr., H.L., F.T. Jones, S.E. Watkins and J.S. Hipp. 2003. New Arkansas laws regulate the use and management of poultry litter and other nutrients. University of Arkansas, Cooperative Extension Service. Publication Number FSA29. September 2003.
November 2009