

UK Poultry and Poultrymeat Statistics - October 2008
By Defra. This monthly publication combines the UK Hatcheries Survey and Poultry Slaughterhouse Survey results together with other Defra statistics, and trade data.Summary
- Broiler chick placings in the UK were up slightly in September from the previous month but the downward year-on-year trend continues. The figure of 64.8 million placed in September 2008 is 1.4% lower than a year previously.
- In September 2008, 1.87 million turkey poults were placed - an increase of 12.7% over the number placed in the same month last year. This contributed to the continued upturn for placings, which reached 16.71 million as a rolling total for the last 12 months.
- The trade gap in commercial broiler chicks widened in the last month reported (August 2008). Imports for the month were 106,400 (-27.7%) compared to the same month of 2007 while exports rose to 797,000 (+21.7%).
- Both imports and exports of turkey poults were down for August 2008 compared to the same month a year previously. The 12-month rolling totals came to just over 701,000 for imports and 934,600 for exports.
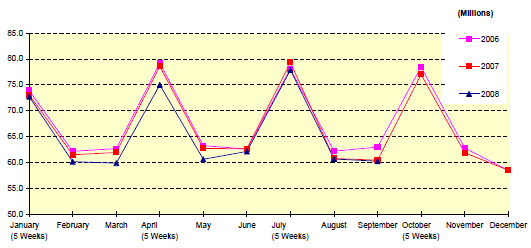
- At 60.3 million, UK broiler slaughterings were down marginally in September 2008 compared to the same month in 2007, while the 12-month moving total was also down at 786.8 million birds.
- Average slaughter weights were broilers, 2.20kg; spent hens, 1.76kg; spent breeders, 3.72kg; light turkeys, 6.02kg; heavy turkeys, 16.80kg; average for all turkeys, 11.58kg.
- Poultry meat imports - both whole birds and cuts - continued to decline.
- For exports of poultry meat, whole birds jumped up significantly but this segment accounts for only a small part of the total export market and overall, exports continued their downward slide.
- The overall effect of the trade situation was a further narrowing of the trade gap between poultry imports and exports during 2008.
Section 1: UK Hatcheries Data - Placings and Eggs Set
Chart 1.1: Monthly UK Commercial Broiler Chick Placings
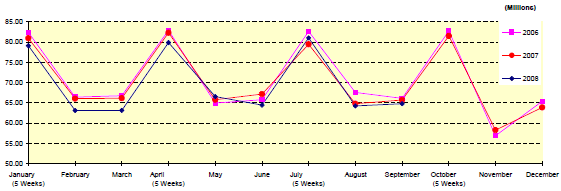
Chart 1.3: Monthly UK Turkey Poult Placings
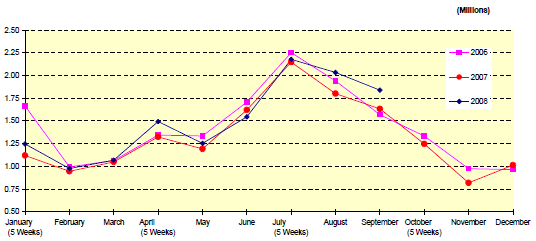

Chart 1.3: Monthly UK Turkey Poult Placings

Section 2: UK Trade in Live Poultry
Chart 2.1: Imports and Exports of Commercial Broiler Chicks
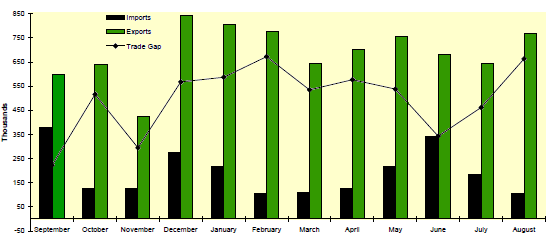
Chart 2.2: Imports and Exports of Turkey Poults
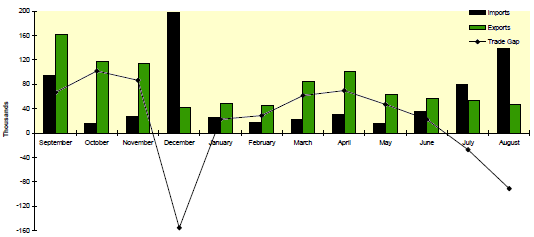

Chart 2.2: Imports and Exports of Turkey Poults

Section 3: UK Slaughterhouse Data - Numbers Slaughtered and Average Weights
Chart 3.1: Monthly Broiler Slaughterings in UK

Section 4: UK Poultrymeat Production, Trade and Domestic Usage (Net of Offal)
Chart 4.2: Imports of Whole Birds and Cuts
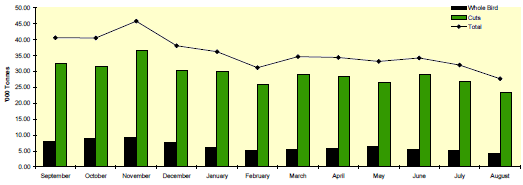
Chart 4.3: Exports of Whole Birds and Cuts
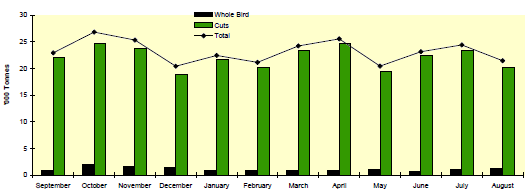
Chart 4.4: Total Poultrymeat Imports and Exports
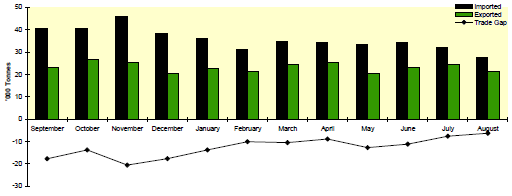

Chart 4.3: Exports of Whole Birds and Cuts

Chart 4.4: Total Poultrymeat Imports and Exports

Further Reading
| - | You can view the full report by clicking here. |
October 2008


