

International Egg and Poultry Review
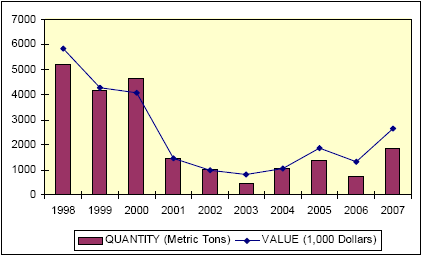
US - By the USDA's Agricultural Marketing Service - This is a weekly report looking at international developments concerning the poultry industry.U.S. Frozen Whole Turkey Exports
1998-2007 January – May Comparisons

Source: Dept of Commerce, U.S. Census Bureau, Foreign Trade Statistics
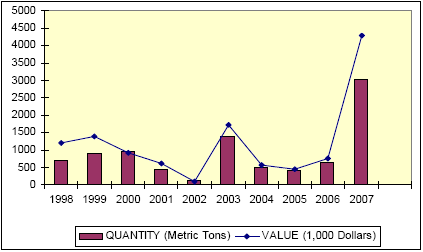
U.S. Fresh Whole Turkey Exports
1998-2007 January – May Comparisons

Source: Dept of Commerce, U.S. Census Bureau, Foreign Trade Statistics
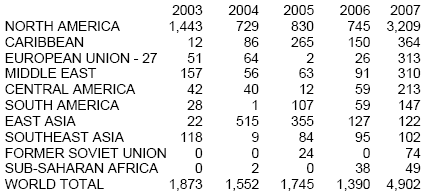
Top 10 Regions of Total Whole Turkey Exports
2003-2007 January – May Comparisons (Metric Tons)

Source: Dept of Commerce, U.S. Census Bureau, Foreign Trade Statistics
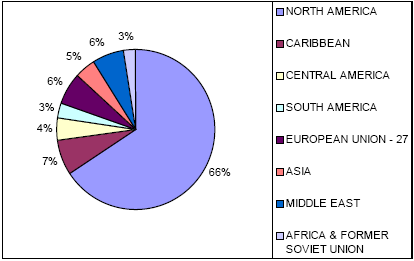
2007 U.S. Whole Turkey Exports By Region
January-May Comparisons (Metric Tons)

Source: Dept of Commerce, U.S. Census Bureau, Foreign Trade Statistics
January-May Cumulative U.S. Frozen Whole Turkey Export By Volume Comparisons
The combined U.S. fresh/chilled and frozen cumulative whole turkey exports for January-May, 2007 are 4,902 metric tons (MT), or 353% above the 1,390 MT in 2006 but 17% below 1998’s 5,900 MT for the same time frame. The majority, over 66%, of U.S. whole turkey exports have stayed in the North America region this year. The North America region consists of Canada, Greenland, Mexico, St. Pierre and Miquelon.
So far this year fresh/chilled whole turkey exports have been about 62% of total whole turkey exports which is a bigger share then last year’s 46% of total whole turkey exports. Frozen whole turkey exports, meanwhile, have ha a significant drop to 38% of total whole turkey exports from 2006’s 54% of total whole turkey exports.
Fresh whole turkey exports for the January-May time frame in 2007 have totaled 3,021 MT, a 477% increase over 2006. Approximately 89% of the fresh/chilled whole turkeys have stayed within North America, or more specifically, Mexico. Mexico’s fresh whole turkey imports for 2007 have increased 464% from the same time frame in 2006. Mexico imported 581 MT in 2006 and 100 MT from January thru May 1998.
Meanwhile, frozen whole turkey world exports for the January-May time frame in 2007 have totaled 1,881 MT, 249% over the 2006 time frame. The majority 27%, for North America and 16% for the Caribbean. However, in 1998 the U.S. exported 5,188 MT on frozen whole turkeys with 55% destined for East Asia and 20% for the former Soviet Union. Exports for East Asia during the January thru May, 1998 time frame totaled 2,842 MT out of which 2,757 MT went to Hong Kong. From January thru March, 2007 the U.S. has only exported 74 MT to East Asia. The U.S. only exported 345 MT to Mexico in 1998 compared to 512 MT in 2007 for the same January-May time frame.
To view the full report, including tables, please click here


