A Closer Look at the Food Vs Fuel Debate
URBANA, US - Symptoms of the food-versus-fuel crisis are appearing regularly in the news but the underlying causes - and long-term implications - are poorly understood. Much of the problems boil down to new Asian wealth, a global desire to eat more meat and a thing called elasticity, all of which can be mapped on a three-dimensional computer, explains Bob Sampson, a University of Illinois agricultural economics professor. 13 May 2008
 5 minute read
"An important component of the food-versus-fuel debate that is not well understood is how increases in wealth for Asian consumers are dramatically affecting the markets for commodities worldwide," said Peter Goldsmith, director of the National Soybean Research Laboratory and an associate professor in the U of I's Department of Agricultural and Consumer Economics.
To help fill that knowledge gap, Goldsmith, Tad Masuda, a postdoctoral researcher, and Barbara Mirel of the University of Michigan have built a 3-D computer model that visually conveys the interrelationship and impacts of income changes around the world on consumption, production, and markets.
* "Not only can we not add land fast enough to meet this rapid rise in demand, but it would place a significant burden on our natural resources" |
Peter Goldsmith, director of the National Soybean Research Laboratory and an associate professor in the U of I's Department of Agricultural and Consumer Economics.
|
"Global Food in 3-D--Version 2" is a Web-based program that will be accessible on a trial basis worldwide to analysts and other interested parties by June.
"It will put the story of food demand at everyone's fingertips," Goldsmith said.
The program deploys three interactive features on the screen--a sidewall, a back wall, and a floor.
On the "side wall," users can graphically display consumption and production data for 15 protein commodities. These can be displayed by country, region, or for the world.
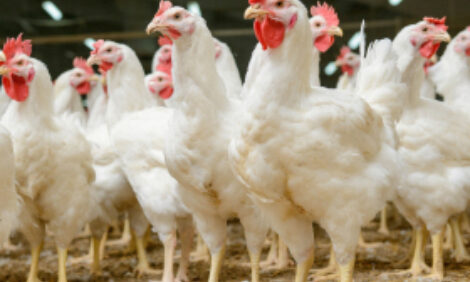
"In the global food system, the production and consumption of commodities are increasingly separate," Goldsmith said. "For example, poultry and pork trade has increased 14 percent to 16 percent per year since 2000, respectively. Brazil is now the largest exporter with Russia and China being the leading importers. The shift in the loci of world poultry and pork production will have larger impacts on underlying feed markets and grain flows."
The "back wall" features country-specific information such as consumption per capita, income elasticities, and population metrics. These data help to demonstrate how income affects consumption.
"The relationship is simple--if I get $1 more in income, I'll not only eat more. If I get significantly more income, I'll eat even more but will shift my consumption to different types of food," he said. "We have that data for every country in the world going back to 1961 and projecting up to 2030."
As a component of the food-versus-fuel debate, there is an economic principle known as "elasticity." Simply defined, this means as incomes move up, food consumption and expenditures change. This is why small increases in income in heavily populated nations like India and China can have major impacts on commodity markets, especially those tied to protein.
"The visualization provided by this program helps one understand this relationship. It provides a vivid demonstration of how the complex system involving income growth, population changes, and food consumption functions," he said.
The "floor" of the model is a map of the world which dynamically reflects changing consumption or production patterns and elasticities over time.
As meat and poultry consumption rises in Asia with increased incomes, a greater demand is triggered for corn and soybeans to feed beef, pork, and poultry. Holding all factors constant, projections indicate that 120 million metric tons more of pork and poultry will be needed by 2030. This means 110 million metric tons more of soybean meal, 140 million metric tons of soybeans, and 62 million hectares of land to grow these additional crops.
"Not only can we not add land fast enough to meet this rapid rise in demand, but it would place a significant burden on our natural resources," he said. "So how do you produce more soybeans?
"I think the answer lies in more research and technical change. Improvements in yield, technologies to reduce input use, and increases in livestock feed efficiency will be critical to meeting future demand while improving the productivity of agricultural inputs and reducing the load on environmental resources."
The Global Food in 3-D model can be used to demonstrate and understand how demand has changed for commodities and where production has been and is going. Poultry, for example, was a commodity largely consumed during the 1960s in the Caribbean, North America, and Europe. By 2007, new countries in other areas of the world were becoming major consumers and a radically different pattern emerged.
"In terms of consumption, poultry was until the 1990s largely a U.S. business," said Goldsmith. "After that, Brazil and China have become major players. China now consumes more poultry than the United States and is projected to consume 40 percent more poultry than the United States by 2030. Where will the grain to feed this poultry come from? This demand is placing a tremendous stress on crop production even without using crops for fuel."
The model allows users to make comparisons. What are the effects on markets when incomes are rising in Asia and what are the implications for the future?
"We also know that as incomes rise, consumers change their food choices. They go first from rice to meat and then in some countries move to high-end seafood," he said. "Other commodities stay basically flat in some countries. In the United States, for example, dairy consumption doesn't seem to change while the big opportunities for dairy appear to be in South America. But each country, at each point in time, for each foodstuff can be unique and makes generalizations risky. Hence, we felt there was a need for a software tool that employed visualization to help simplify a complex situation."
Asia can't produce the food needed to feed its population, Goldsmith added. "That food will have to come from the western hemisphere. China, once the home of the soybean, is now the world's largest importer of soybeans."
All of these complex and interrelated developments become clearer when moving across the screen with its tables and maps.
Goldsmith noted that the original idea for the model was developed earlier this decade by Steven Sonka, a former director of NSRL and retired professor of agricultural economics, and his then-doctoral student Donna Fisher. They studied how visualization helped managers make better decisions when dealing with complex problems in the future. The Illinois Soybean Association and the Soybean Disease and Biotechnology Center provided support for development of the software.