

CME: Group Futures Sharply Lower
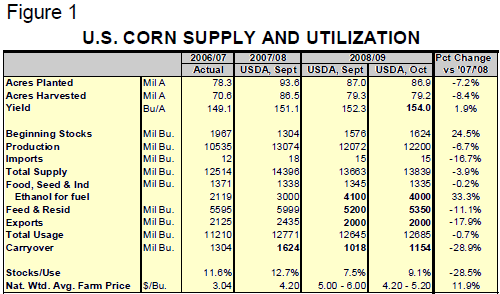
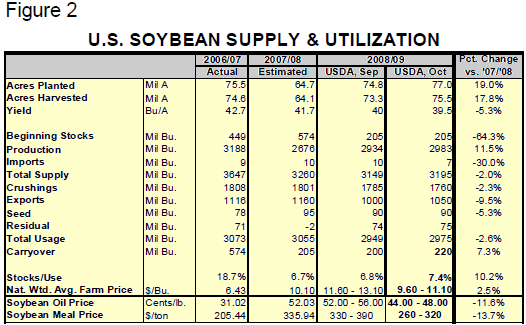
US - CME's Daily Livestock Report for 14 October 2008.Friday’s Crop Production and World Agricultural Supply and Demand Estimates from USDA included higher crop and carryout forecasts for both corn and soybeans but still predicted higher prices relative to the 2007-08 crop year. CME Group futures were sharply lower on Friday, gained some ground on Monday and, especially for soybeans, were lower again Tuesday. It is practically impossible to judge just how much of these price changes are attributable to the report versus the influences of the current credit crunch and resulting financial panic but it is safe to say that Friday’s higher predicted output figures contributed to lower futures prices. Supply and Use tables for both corn and soybeans appear below.


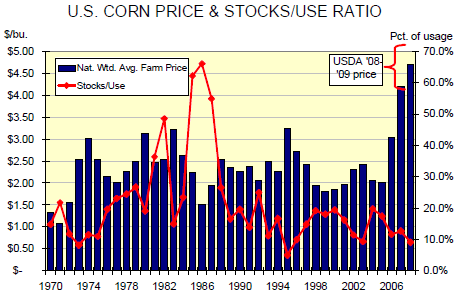
The bottom line for corn is an increase in projected year-end 2009 carryout stocks to 1.154 billion bu., 136 million higher than in September. That number is still nearly 30% smaller than this year while total usage remains roughly constant. The year-end stocks/use ratio now stands at 9.1%, up for 7.5% in September but down from this year’s 12.7%. That would still be the third lowest S/U ratio since 1970. USDA lowered its forecast price range by 80 cents on each end from September but the midpoint is still $0.50/bu. higher than this years estimated average price of $4.20/bu.
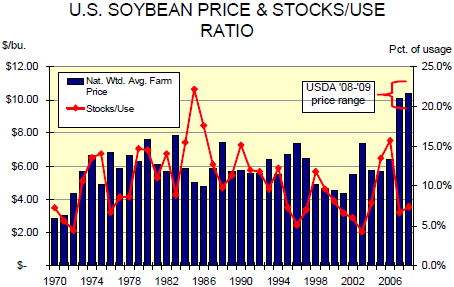
Soybean estimates are a tale of discovered acres — 2.2 million more in both the planted and harvested categories. Those acres plus a substantially higher 2008 year-end stocks number (205 million vs. 140 million) increased total availability by over 100 million bushels. Estimated crush was reduced slightly while exports were increased by 50 million bu. The changes left total predicted usage at 2.975 billion bu. and year-end stocks at 220 million bu. The year-end stocks/use ratio is now predicted to be 7.4%, up from 6.8% in September and 6.7% for this year. The mid-point of USDA”s forecast price range, though, is HIGHER than this year’s price ($10.35 vs. $10.10) by 2.5%. That strikes us as odd given concerns about demand and trade. Even more odd is the fact that the prices of soybean meal and oil are predicted to be 11.6% and 13.7% LOWER, respectively, than this year.


Further Reading
|
| - | Go to our previous news item on this story by clicking here. |
| - | You can view the WASDE report by clicking here. |


