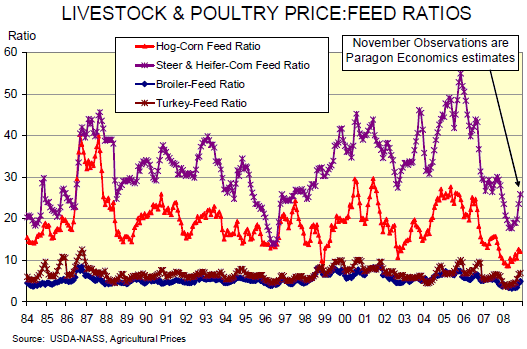


CME: Price:Feed Ratio for Livestock and Poultry
US - CME's Daily Livestock Report for 26th November 2008.Ratios of livestock and poultry prices to the price of corn or feed have long been used as an indicator of producer profitability and thus motivations to change output. USDA publishes data for the two major red meat species, poultry, eggs and milk each month in its Agricultural Prices publication, released near the end of each month. The November release will be Friday afternoon and, while we expect it to show some improvement in the ratios due to lower corn prices, we do not expect them to be much to shout about given current output prices.
The chart below shows historical monthly observations back to 1984. The November observations are our estimates of what USDA will publish on Friday. Agricultural Prices is not too specific about the price series it uses to compute these ratios. We simply used historic prices for Omaha corn, 5-market fed cattle, national weighted average net hogs, 12- market broilers and hen turkeys and historic ratios to estimate these. They are quite logical directionally. We’ll see on Friday just how accurate they might be.

Ratios for all species except hogs are predicted to improve in November, driven almost entirely by lower corn prices. That corn price decline (roughly 10% from October) was not enough to offset seasonally lower hog prices.
Comparing ratios from recent months to the historic data show clearly why there has been so much recent consternation about profitability in the meat protein business.
Chicken:feed ratios were the lowest on record this summer. The resulting losses have driven the unprecedented reductions in egg sets and ongoing reduction in the breeder hatchery flock, both of which should contribute to improvement in the chicken ratio very soon.
Turkey:feed ratios also set record lows this past summer but are much higher due to strong seasonal influence. That seasonal pattern is very clear in the historical data.
Hog:corn ratios have been below the 20:1 level that usually symbolized breeding herd changes since October 2006. They went below 10 this summer for only the second time ever but did not reach record lows; that distinction still rests with the price debacle of 1998 when the ratio hit 7.5. U.S. producers were relatively slow to respond to ratios less than 20:1, taking about 18 months to reduce the breeding herd below yearearlier levels. That usually happens in about 12 months — but the breeding herd usually grows much more than the 1-2% rate we say during 2004- 2006 when the ratio was well above 20.
Fed cattle:corn price ratios have also avoided record lows this summer but are still far short of profitable levels. The record lows for fed cattle occurred in 1995-96 when corn prices coincided with large fed cattle supplies and low prices. It took a long time, but the low cattle:corn ratios have finally been bid back into lower yearling and calf prices this year.


