

CME: Relationships among Corn Price Series
US - CME's Daily Livestock Report for 28th November 2008.A potential problem was raised in the past week - one that needs to be remedied. However, the readers' input is required. The reader inquired “What in the world does cwt mean?” To those of us who have been doing this for nearly as long as we can remember, cwt is the supposedly universally-known abbreviation for “centi-weight” or “hundred pounds.’ By using it, cattle prices of 92 cents per pound easily become $92.00/cwt. The same approach is used for hogs, meat, etc.
But the point of this is that we use market analysis and trading jargon that some readers may not understand. That is especially true for our growing number of international readers who should probably be happy that Steve Meyer has to write English instead of delivering these in spoken form using his Oklahoma English. Regardless, we would like to do a future issue that provides a glossary of terms and could use your input. Please go to www.dailylivestockreport.com and send an e-mail to Steve using the link on the right side of the homepage screen. We will compile the terms that you submit and devote an issue in the near future to breaking some communication barriers! We apologize for this item being perhaps long overdue.
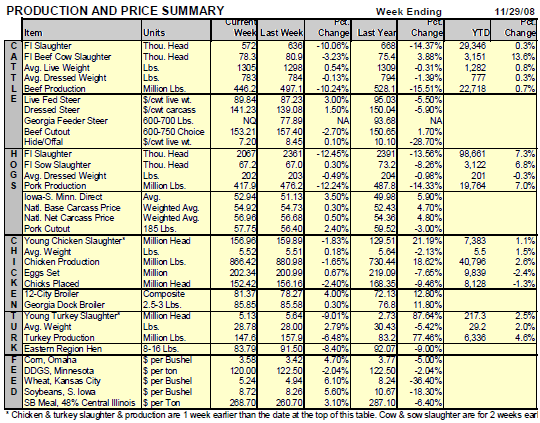
The week-on-week and year-on-year supply comparisons in this week’s data table have little meaning since the U.S. Thanksgiving holiday fell as late as it possibly can this year with the fourth Thursday falling on the 28th. That means that we are comparing partial weeks to full weeks or, in the case of both chicken and turkey which are lagged one week, full week’s this year to partial weeks last year. We will pay some attention to two-week totals next week.
The price comparisons are still valid and we can see some softness in beef prices but strength in cattle prices last week and just the opposite when we compare to one year earlier. Hog prices were stronger versus one week ago and markedly higher than one year ago. Cutout values improved 2.4% — more than did hog prices — and helped packer margins last week. Composite broilers at +11.8% and Georgia dock broilers (smaller birds primarily used for fried chicken) at +12.8% from last year are good new but, again, have more to do with BAD prices last year than with price improvements due to ongoing cutbacks. Actual slaughter reductions are just now materializing.
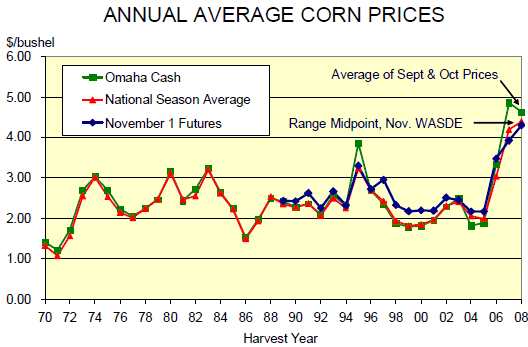
Figure 1 shows some interesting relationships among various corn price series that we thought readers might find useful. USDA’s monthly World Agricultural Supply and Demand Estimates (WASDE) contains a forecast for the national season-average farm price. The Omaha cash price is one of the most widely quoted in the trade. Note that in high-price years, Omaha cash has exceeded the national season-average price by about $0.65/bushel — due largely to the national season-average being weighted by farm sales and farmers frequently selling quicker and at lower prices in uptrending markets. We thought it would also be interesting to see how the average of all listed corn contracts on November 1 of the harvest year compared to the other prices. November 1 CBOT/CME Group futures were consistently higher than the other prices from ‘97 through ‘06 but were sharply lower than the others last year, owing to changing basis relationships and, in our opinion, some understandable under-estimation of oil prices and the new, tighter relationship of corn prices to oil price.


