CME: Negative Reaction to WASDE Estimates
US - CME's Daily Livestock Report for 12 January 2009. 13 January 2009
 2 minute read
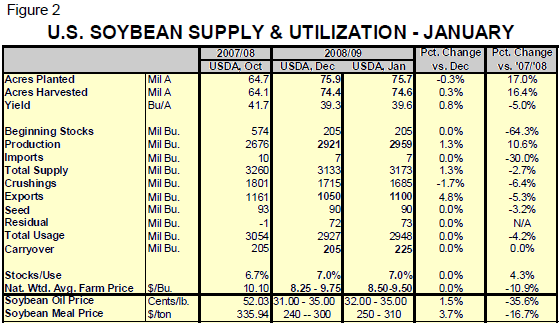
Those thuds you heard at various times on Monday were the sound of CME Group grain futures hitting downward limits in the wake of Monday’s USDA Crop Production and World Supply and Demand Estimates (WASDE) reports. Grain markets reacted quite negatively to USDA’s estimates for larger 2008 crops of both corn and soybeans and declining usage rates for both crops. The key data from the reports appear in the tables below. Some key items for livestock producers are:
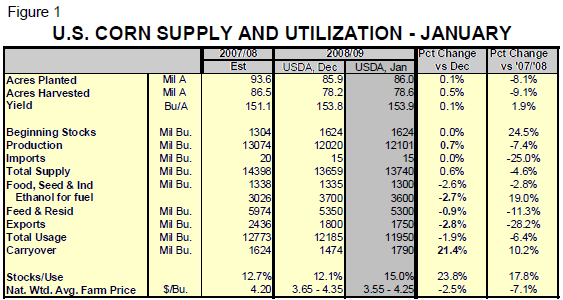
- Higher 2008 corn output due to slight increases in planted acres, harvested acres and yield. The combination of those factors drove the estimated corn crop to 12.101 billion bushels, 0.7 per cent larger than the December estimate but still 7.4 per cent smaller than last year’s record crop of 13.074 billion bushels.
- Lower ethanol usage. USDA reduced the usage levels for ethanol for the second straight month. Total ethanol usage is now forecast to be 3.6 billion bushels. That number is 100 million lower than the December estimate and, assuming an ethanol yield of 2.8 gallons/bushel, BELOW THE 3.75 BILLION BUSHELS NEEDED TO MEET THE RENEWABLE FUEL STANDARD’S REQUIRED 10.5 BILLINO GALLONS IN 2009. Ethanol blenders can use RINS (or credits) earned for exceeding the standard in years past to meet the 2009 standard and there is believed to be enough RINS available to account for about a 10 per cent shortfall. Given the economics of the ethanol business at present, don’t be surprised if this number continues to decline.
- Lower estimates for all other corn uses as well. Exports were cut by another 50 million bushels and non-ethanol food/industrial usage was cut by 35 million, both no doubt functions of concerns about the worldwide economy. Feed usage was reduced another 50 million bushels as well and now stands 11.3 per cent lower than last year. That still looks like a large reduction to us since livestock and poultry reductions are MUCH smaller — from 3% or so for pork to, perhaps, 6-7 per cent at the outside for chicken. Interestingly, USDA only forecasts a 4.7 per cent decrease in domestic soybean meal usage. Even adjusting for more DDGS (and the increase there is dwindling!), it appears that livestock and poultry diets are going to much higher in protein content this year.
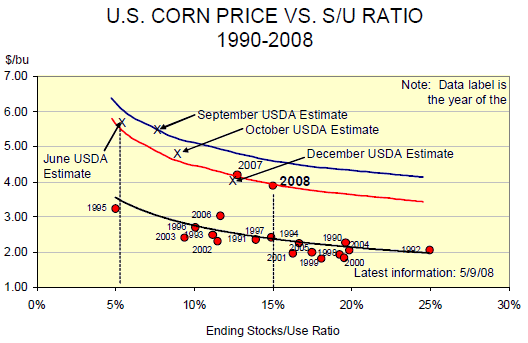
- A 21.4 per cent increase from the December estimate for projected 2009 corn carryout — to 1.79 billion bushels. That level is 10.2 per cent higher than last year and the largest since 2006. The historic relationship between ending stocks to use ratio and price is shown at left. The January observation is labeled 2008. Note that USDA estimates still appear to lie on a higher corn demand curve than we have historically used but a lower one than was being postulated last June.
- Higher soybean production, lower crushing, higher exports and higher carryout stocks — yet HIGHER meal prices relative to the December estimates. SBM price is expected to be 17 per cent lower, though, than in ‘08.