

CME: What's to Determine Meat Prices in 2009?
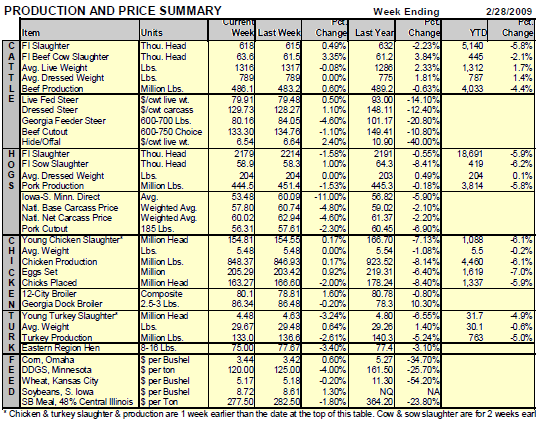
US - CME's Daily Livestock Report for 27 February 2009.CME has discussed the rather obvious fact that demand is a huge risk factor for 2009 and, since we doubt that the people in charge in Washington are going to offer any meat demand stimulus packages, our concern remains high. The year-on-year change figures in this week’s Production and Price Summary add some credence to those concerns. FI cattle slaughter was down 2.23 per cent last week from one year ago at the same time that live and dressed steer prices were down as well. Not exactly a relationship that supports a downward sloping demand curve. FI hog slaughter and hog prices last week were also both below the levels of one year ago. Chicken slaughter/production and the 12-city composite broiler price had the same year-on-year change signs last week — though the Georgia dock broiler price, which represents a smaller bird usually destined for food service, was over 10 per cent higher this year. Even turkey prices were lower last week versus 2008 while turkey supplies were down over 6.5 per cent.
We have seen some instances of this in past weeks, especially in the beef sector but this is the first week that the relationships was expressed in all species. We fully realize that one week does not a trend make but the breadth of these same-sign relationships at farm and wholesale levels are troubling and are certainly worthy of watching closely in weeks to come.
Now we wouldn’t be living up to our economist pedigree if we didn’t chime in with an “On the other hand . . . “ — so consider the most recent demand information from the University of Missouri. Professor Glenn Grimes’ released demand indexes last week for the 3-month period from November through January that indicate that US consumerlevel demand actually improved relative to one year ago. Professor Grimes figures show pork demand up 2 per cent, beef demand up 1 per cent, broiler demand up 5.6 per cent and turkey demand up 3.8 per cent during that period. In addition, live hog demand was 1 per cent higher while fed cattle demand was down 5.1 per cent.
How do these square with recent markets? First, remember that they are for November through January and markets have been pummeled by continued bad news and negative expectations since then. Second, Professor Grimes quite correctly uses deflated retail prices as part of his calculations to determine the whether a demand curve has moved. Under “normal” inflationary conditions, these real prices generally fall from year to year, requiring a larger per capita consumption increase if an increase of demand is to be shown. But from November through January, there was no inflation (the all-item CPI actually fell by 1.3 points or 0.6 per cent). That means that smaller volume increases (or, depending on what direction retail prices moved, even volume declines) were needed to conclude that demand had increased. And the domestic per capita consumption increases needed to support a conclusion that demand is higher are much easier to come by now as exports have softened. Finally, the retail prices of all species are significantly higher than one year ago as the retail market finally responds to the lower domestic availability that started last year when exports increased.
Which of these dueling demand stories will prevail in 2009? The answer to that will be a major determinant of livestock and meat prices.


