

International Egg and Poultry Review
US - By the USDA's Agricultural Marketing Service (AMS). This is a weekly report looking at international developments concerning the poultry industry. This week's report covers US chicken paw exports.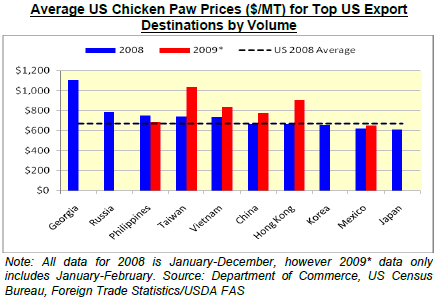
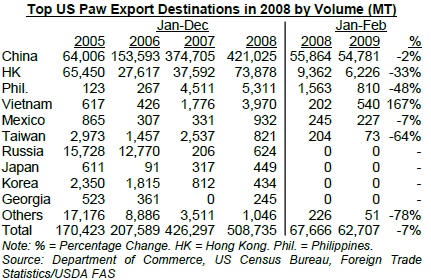
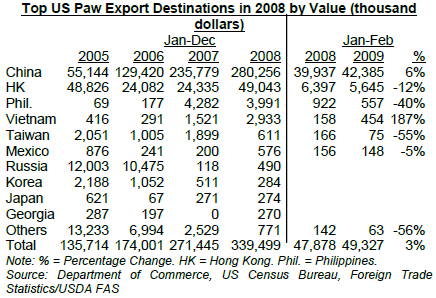
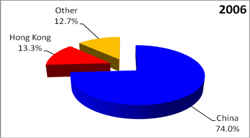
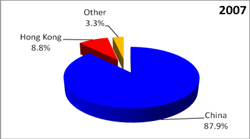
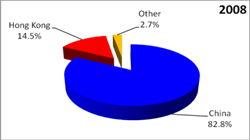
Based on data, China and Hong Kong together accounted for 97.3 per cent of US chicken paw exports in 2008 and in the first 2 months of 2009. China imported 421,025 metric tons (MT) of US paws in 2008 and 54,781 MT in the first 2 months of January – February 2009, while Hong Kong imported 73,878 MT and 6,226 MT respectively.
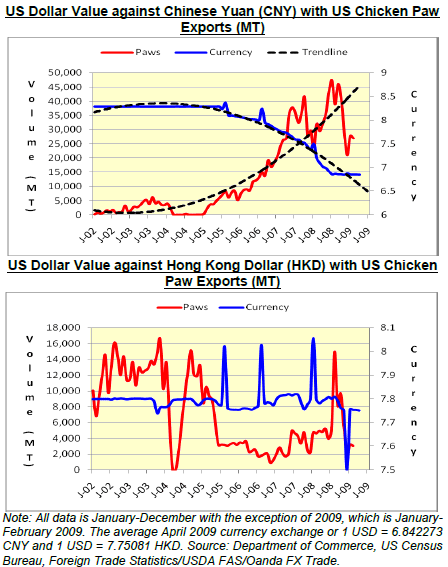
Based on paw export values, the US’s largest importer in 2008 was again China. Many of the same leaders in 2008 continued into 2009 with the exception of Mexico taking a lead of $73,000 over Taiwan in US paw imports. In regards to unit value (dollars/MT), Georgia led in 2008 with $1,102 per MT followed by Russia ($785), Philippines ($752), Taiwan ($744), Vietnam ($739), China ($666), Hong Kong ($664), Korea ($654), Mexico ($619), and Japan $610). The average price for US paw exports in 2008 was $667 per MT. Based on the charts, US chicken paw exports increased with the weakening US dollar value since 2005; however no correlation existed between the weakening US dollar and US paw exports to Hong Kong even though exports have decreased since late 2004.
Source: USDA FAS
| Percentage of US Paw Exports by Volume to China, Hong Kong, and All Other Destinations | |
 |
 |
 |
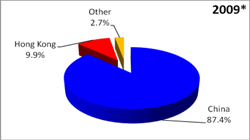 |
| Note: All data is January-December except for 2009*, which only includes exports from January-February. Source: USDA FAS |
|
Further Reading
| - | You can view the full report by clicking here. |


