

CME: Low Chicken Demand Index
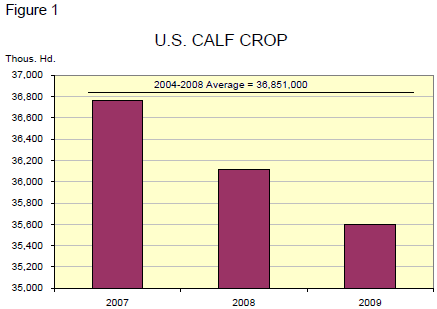
US - An observant reader asked about the difference between the calf crop numbers we discussed in the July 24 edition and the numbers in the chart labeled US Calf Crop in that issue, says CME's Daily Livestock Report for 30 July.His confusion was understandable since the numbers in the chart were actually the number of cattle on US farms on July that weighed 500-lbs o less. The actual calf crop chart appears as Figure 1. It looks quite similar to the 500-lb. and under inventory but the numbers on the Y axis are different. USDA predicts that we will see 1.2 million fewer calves born this year than just two years ago. That is an important comparison because the animals in this year’s slaughter were, pretty much, part of that 2007 calf crop. We think that speaks volumes about slaughter levels in 2011.

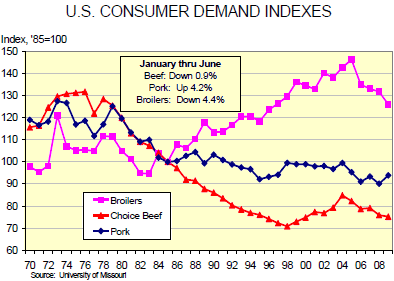
Demand indexes for January-June, released this week by the University of Missouri, continue to appear just as we expected them to appear in this recession—even though the pork demand index is substantially higher than even the optimistic among us had likely thought possible. The numbers from Professor Glenn Grimes appear at left along with the historical data for these indexes. Remember that these indexes are strictly descriptive. They indicate the apparent movement of the various demand curves in P-Q space but offer no information as to why those movements may have occurred. That interpretation is up to us market observers and analysts. Some critical issues with this month’s indexes:
- The consumer-level pork index is surprisingly strong and the reason is that USDA’s June retail price data show NO DECLINE from May even though domestic pork disappearance was 14.5 per cent higher than last year and 4.8 per cent higher than in 2007. June 2009 domestic disappearance was the second highest ever for June. Readers should note that a big reason for the 14.5 per cent year-on-year increase was VERY low domestic disappearance last year when exports were near record high. And an extra slaughter day this year helped as well since disappearance is simply the residual after we deduct all of the measured uses from total supply which is the sum of production, imports and beginning stocks. We find the disappearance numbers quite believable but we don’t for a minute believe the retail price was constant given the widespread featuring of pork in June to keep large supplies moving.
- The lower chicken demand index is caused by prices that have not improved as much as sharp reductions in US output and disappearance would have suggested. We believe it is likely that his situation will eventually be rectified but it will almost certainly require enough economic recovery to get people back into the habit of eating out. While some indicators suggest that the recession may be easing, unemployment and payrolls will almost certainly lag that recovery so a bounce for chicken demand may be slow in coming.
- Ditto the chicken situation for beef with one exception: retail beef prices in June fell by 0.5 per cent from last year. Total domestic beef disappearance in June was 2.6 per cent lower than in 2008.


