


International Egg and Poultry Review - United States
US - By the USDA's Agricultural Marketing Service (AMS). This is a weekly report looking at international developments concerning the poultry industry. This week's report focuses on US exports of leg quarters.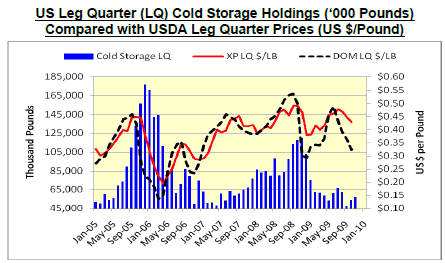
Note: All data from 2005-2008 is January-December; 2009 data only includes January-October. XP LQ $/LB = USDA FAS Export Leg Quarter Prices per Pound. DOM LQ $/LB = USDA PYMNA Domestic Leg Quarter Prices per Pound.
Source: USDA NASS/Department of Commerce, US Census Bureau, Foreign Trade Statistics/USDA FAS/USDA AMS Poultry Market News & Analysis (PYMNA)
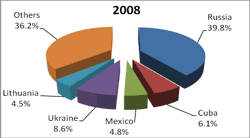
The US exported a total of 1,555,100 metric tons (MT) of chicken leg quarters from January through October of 2009, which is four per cent lower than total exports a year ago (1,611,579 MT). Russia continues to be the largest destination of US leg quarter exports even though exports from a year ago were down 14 per cent. Other decreases from 2008 include Ukraine (-49 per cent), Angola (-19 per cent), and Turkey (-2 per cent). On the other hand some destinations saw large increases from 2008 especially to Iraq and Georgia with increases of 113 per cent and 91 per cent, respectively, e.g. Cuba +1 per cent, Mexico +34 per cent, Lithuania +12 per cent and China +17 per cent.
2009 also saw another year of record high US leg quarter prices. According to USDA AMS Poultry Market News and Analysis, fresh domestic bulk leg quarter prices peaked in June at 48.94 cents FOB, whereas in 2008 levels reached as high as 53.70 cents FOB in August. Domestic and export prices typically trade at similar levels.
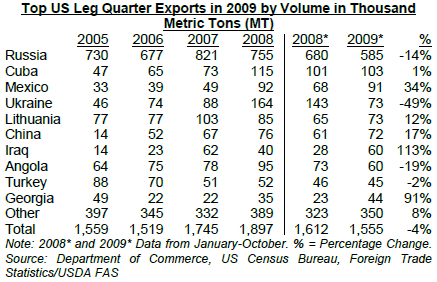
Note: 2008* and 2009* Data from January-October. % = Percentage Change.
Source: Department of Commerce, US Census Bureau, Foreign Trade Statistics/USDA FAS
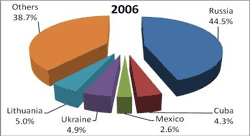
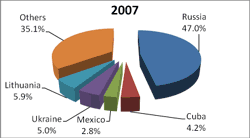
| Percentage of US Leg Quarter Exports by Volume to Russia, Cuba, Mexico, Ukraine, Lithuania, and All Other Destinations | |
 |
 |
 |
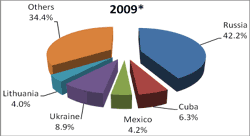 |
| Note: All data is January-December except for 2009*, which only includes exports from January-October. | |
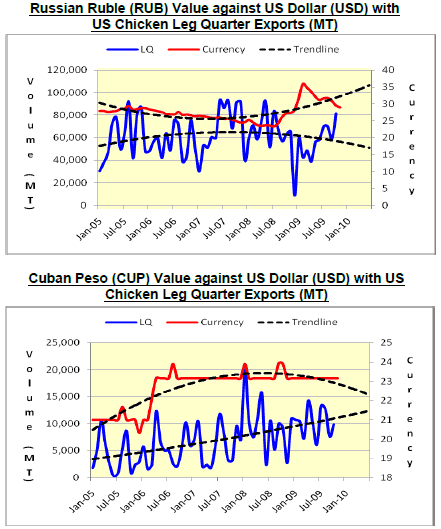
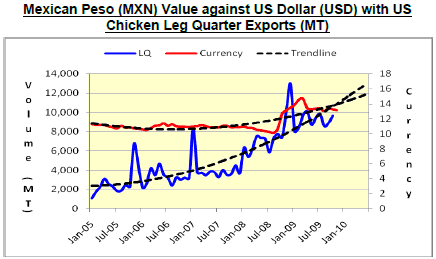
Note: All data is January-December with the exception of 2009, which is January-October 2009. The average November 2009 currency exchange or US$1 = 29.00087 RUB, 23.1481 CUP and 13.14009 MXN.
Source: Department of Commerce, US Census Bureau, Foreign Trade Statistics/USDA FAS/Oanda FX Trade.
Further Reading
| - | You can view the full report by clicking here. |


