

CME: Corn and Soybean Markets Under Pressure
US - All eyes will be on USDA’s monthly Crop Report and World Agricultural Supply and Demand Estimates (WASDE) when they are released at 8:30 EST on Monday, write Steve Meyer and Len Steiner.If you missed them, the 5 February edition of DLR contained the results of both the Dow Jones and Bloomberg surveys of industry analysts. We think you are likely to hear two quite different arguments about corn and soybean markets, regardless of what the report says — because both arguments have merit regardless of what the report says.
The bearish argument will focus on the following:
- Larger-than-expected world supplies of corn and larger supplies of soybeans will keep both markets under pressure. In its January WASDE, USDAraised the 2009 US crop significantly and had 95 million bushels more corn coming from the combined Argentine and Brazilian corn crops this spring. USDA also predicted that the two countries’ soybean output would be nearly 1.2 billion bushels higher this year than in 2009.
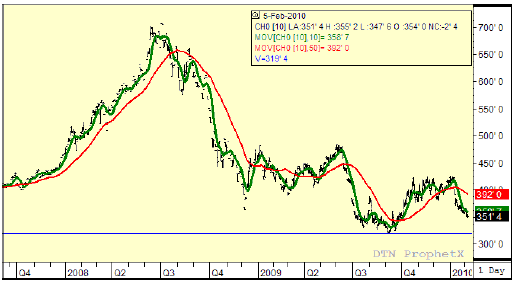
- VERY week technicals for corn futures. The March chart appears at right but it is quite similar to all of the corn charts. The retracement from a high of $4.26 on 4 January has now covered the gap left in August at $3.60. There are no other gaps below Friday’s close of $3.515 but there isn’t much support below that level, either. In fact, it appears that the only real support would be the contract life lows just below $3.20 set back in September before harvest really got started.

- A stronger dollar that will dampen export demand. In spite of small losses for the nearby contracts on Friday, the dollar has gained 8.5 per cent since the most recent lows were made back in November. We realize that all of the monetary fundamentals — deficit spending, a record-large US deficit, cash infusions from the Fed and the Treasury — point to a lower dollar. Higher supplies of dollars almost always mean inflation, dollar weakness and higher nominal interest rates. We can’t argue with that scenario but our trouble with it is that seemingly EVERYONE buys it. And consensus on about anything economic is frequently wrong. Add in the recent uneasiness in Europe about the financial status of a few EU members and we are reminded that the US dollar’s value hinges largely on the status of other economies and currencies. Things may not look peachy for the greenback but it remains a safe haven — at least for now — whenever anything goes awry elsewhere.
The bulls will point primarily to ethanol and feed/residual usage. Their points will be:
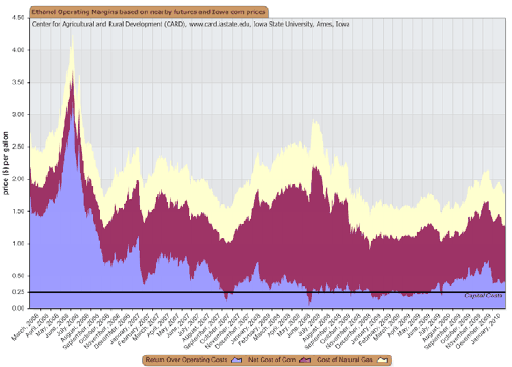
- Ethanol’s position as part of the Renewable Fuel Standard is now solid, plants are in the black and there is excess capacity. All of those point to higher ethanol output and corn usage. The chart at right shows the ethanol margin calculations from Iowa State’s Center for Agricultural and Rural Development as of 22 January. They were not as large as in late November at that time but they have improved since 22 January as corn prices have fallen.
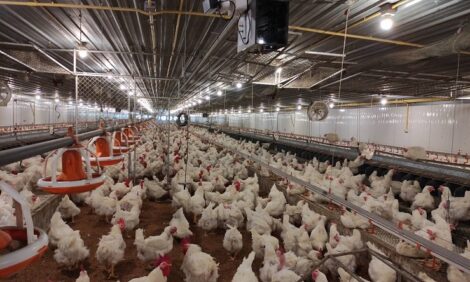
- Potentially higher corn usage due to quality issues. Livestock feeders are having substantial difficulties with mold and toxin levels (primarily in the east) and low test weights which are associated with low protein and energy levels, the latter due to lower starch density. Add those up and they mean lower feed efficiency and more corn usage. We have heard concerns about ethanol yields as well. Normal yields are 2.8 gallons of ethanol per bushel of corn. It seems logical that lower starch density would driven yields down.


