CME Report: Price: Feed Ratios
US - The daily livestock report, by Steve Meyer and Len Steiner looks at the USDA's estimated September price: feed ratios. 30 September 2010
 5 minute read
Our discussion of mandatory price reporting for wholesale pork cuts in yesterday’s edition elicited several questions from readers that we think it best to answer.
First, do not be anxious to see the data from this system because it will be a while before any is available. The clause regarding wholesale pork reporting in the MPR reauthorization calls for “negotiated rule making” by USDA, a process that takes longer than the normal rule making process. The specification was requested by producer groups who would like the impacted parties — producers, packers, processors and retailers to be the primary participants in crafting the rule. That desire is not so much to exclude anyone as it is an effort to get the people who understand the wholesale pork trade best at the table when the system is designed.
The consensus at present is that pork will be much more complicated than was beef because of all of the various specs involved and the lack of standardization of pork cuts. Where both buyers and sellers know exactly what a 112A Ribeye or a 167A Knuckle is, the specs and communications for pork cuts will be a bit more difficult. Second, to our knowledge, nothing has been decided about anything at this point. USDA may keep prices on an FOB Omaha basis or they may got to FOB plant basis. Some ideas have been kicked around but nothing is set. The rulemaking process will allow opportunities for comments before the final rule is published. We will try to keep you up-to-date on the process.
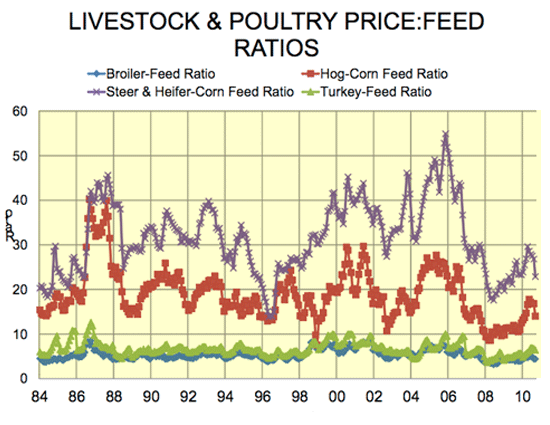
USDA’s Economic Research Service published its estimates of September price:feed ratios as part of its Agricultural Prices release yesterday and they show significant deterioration of profit prospects for cattle feeders and hog producers. The ratios for fed cattle, hogs, broilers and turkeys since 1984 appear at right. A few important features of the chart and recent observations are:
- Chicken and turkey ratios are MUCH lower than are those for fed cattle and hogs primarily because the poultry ratios use feed as the denominator instead of just corn. The turkey feed used in these calculations is comprised of 51 pounds of corn, 28 pound of soybeans and 21 pounds of wheat. The broiler diets are comprised of 58 pounds of corn and 42 pounds of soybeans. While these formulations make the value of the feed higher and thus the ratios lower, they also mean that the denominators of these ratios are less influenced by corn prices. So beans and soybean meal have risen by a lower percentage than has corn this summer, providing some advantage to these heavy SBM users and keeping their price:feed ratios from falling much.
- While the fed cattle and hog price ratios had improved since early 2008, neither one was anything to shout about before this downturn began in April and May. The cattle ratio at 30:1 pushed fed cattle margins into the black last spring primarily because feeders took those higher costs out of feeder cattle prices. So, while feedlots may have been profitable at the lower ratio, cow-calf margins were tighter, a factor in this year’s beef cow slaughter being 10.7 per cent larger, YTD, than last year as of September 11. A hog:corn ratio of 18:1 has long been thought of as a minimum for hog profits but 17:1 had hog producers in the black last spring, The “new normals” of feed and livestock prices appear to be redefining just what these ratios mean — if they still mean much. 20:1 has been the historical minimum to elicit expansion. That one seems to be holding based on last week’s pig report.
- The cattle and hog ratios have fallen sharply since late spring. September’s fed cattle:corn ratio was 22.9. That compares to 29.6 in April and 26.3 one year ago. The September hog:corn ratio was 14:1, down sharply from May’s 17.8:1 but significantly higher than last year’s 11.6:1. Last September’s hog ratio was driven, of course, by low hog prices while this year’s is driven by high corn prices. It is very possible that, in this new world of ag prices, the ratios’ implications change depending on the primary driver at any point in time. The same ratio value may well have different implications depending on which component is abnormally high or low.