

CME: Wholesale Meat, Poultry Show Signs of Strength
US - Demand for wholesale meat and poultry is showing some signs of significant strength in recent weeks — strength that should be duly noted by market participants, write Steve Meyer and Len Steiner.While we have — quite justifiably — spent much of our time this fall discussing and, at times, cussing the status of grain markets and the impacts they are having on producers’ costs and profit prospects, the price-quantity relationships for the three primary meat proteins have indicated strong demand.
The approach here is admittedly simple — compare the yearover- year percentage change for weekly production and weekly wholesale prices for each species. Using year-over-year comparisons removes (or at least minimizes) the impact of seasonality since the seasonal forces should be the same in the two compared quantities or prices. Higher production (positive percentage change) should be accompanied by lower prices (negative percentage change) and vice versa if demand is stable. But even a negative relationship between production change and price could indicate a shifting demand curve if the relationship does not agree with estimates of wholesale demand elasticities.
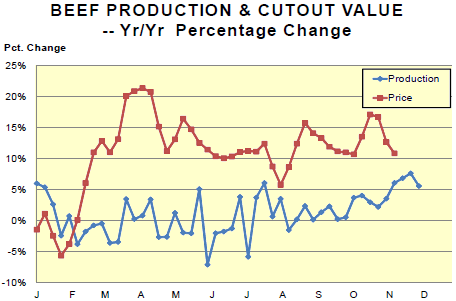
Consider the top chart (below) for beef. Since August — and especially since October 1 — the year-on-year changes for both production and price (the price used here is the weighted average Choice-Select cutout value) have both been positive. The only way that happens is for demand to have moved up and to the right in a standard supply and demand diagram. But from February through July, the percentage increase in price was MUCH larger than the percentage decrease in production. The elasticity of demand for wholesale beef demand has been estimated to be around –0.5, meaning that one would expect a 1 per cent decrease in production to cause a 2 per cent increase in price. The size of this year’s price increases suggest that wholesale demand has been strong all year — and has been especially strong since October 1.
And the charts for pork and chicken suggest the same thing — with the pork relationship being truly remarkable.


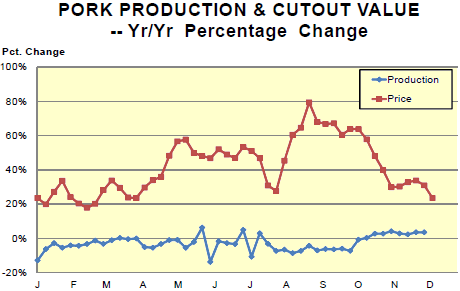
Pork production was consistently below year-ago levels through September and some of the year-on-year declines were large, reaching 7 and 8 per cent in some non-holiday influenced weeks. But pork cutout values were over 20 per cent higher in virtually every week and were 50 to 60 per cent higher from May through July. Part of that is attributable to very low prices in May-July 2009 in the wake of the H1N1 influenza scare. But price change multiples of -7, -8 and -9-to-1 still suggest very strong wholesale demand. And since October 1, the story is the same for pork as it is for beef: Higher output and higher cutout values. Only higher demand can cause that!
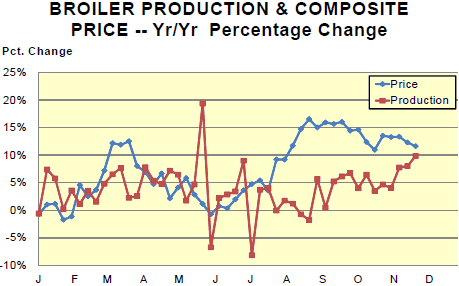
And broilers make a trifecta. Prices have been higher in spite of higher output almost all year but, here again, the relationship has strengthened this fall with high prices and growing production since September.
There are several reasons that these differ sharply from our retail demand indexes. First, export growth will drive wholesale demand. Second, retail prices quite naturally move slower than do wholesale prices, especially when retailers are trying to hold the line on consumer costs. And finally, we still wonder about the quality of USDA’s retail price series based on raw data from the Bureau of Labor Statistics.


