

International Egg and Poultry Review: US
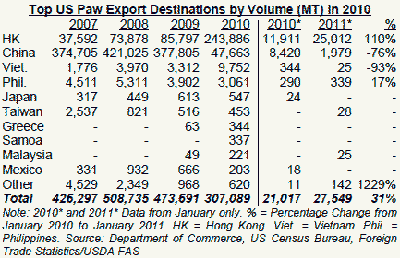
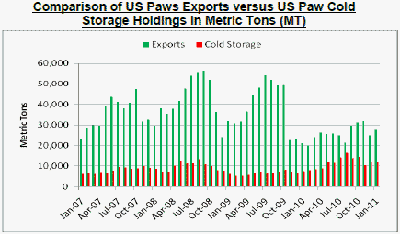
US - This is a weekly report by the USDA's Agricultural Marketing Service (AMS), looking at international developments concerning the poultry industry. This week's review looks at US paw and feet exports.The US shipped a total of 307,089 metric tons (MT) of paws and feet in 2010, 35 per cent lower than in 2009 (473,691MT) and 40 per cent lower than in 2008 (508,735MT). In January 2011, the US exported 27,549MT of paws and feet, 31 per cent higher than in January 2010 (21,017MT) and 14 per cent lower than January 2009 (31,959MT).
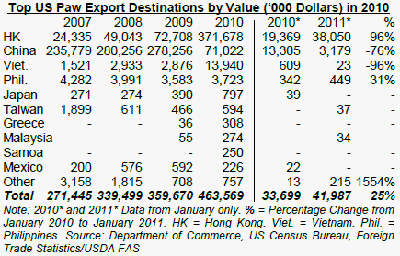
Typically, the US ships most of its chicken paws and feet to China and Hong Kong, which comprised about 98 per cent of total US paw and feet exports in 2010 versus 97 per cent in 2009. In January 2011, the US exported about 95 per cent of its paws and feet to China and Hong Kong. However, US paw exports declined a total decline of 37 per cent into both Hong Kong and China from 2009 to 2010 due to a variety of trade issues.
The decline can be attributed to the following issues between China and the US: Section 272 of the US Omnibus Appropriations Act of 2009; the value of the Chinese Yuan; protectionism claims; US duties levied on Chinese-made low-end tires, steel pipes, movies, and books; China's anti-dumping case filing in April 2009; China's anti-dumping (AD) and countervailing (CVD) import duties imposed February 2010; and the World Trade Organization (WTO) ruling in favour of China in August 2010 resulting in continued duties in 2011. As a result, US paw and feet exports increased significantly to the following markets from 2009 to 2010: Greece (+445 per cent), Malaysia (+351 per cent), the Bahamas (+209 per cent), Viet Nam (+194 per cent), and Leeward-Windward Islands (+33 per cent).
Of China's poultry imports, chicken paws account for about 50 to 60 per cent of the total. Brazil became China's primary chicken paw supplier in 2010 followed by Chile and Argentina. In 2009, Brazil did not export any paws to China. Despite everything, Hong Kong and China continued to be the top market for US paw and feet exports in 2010.
Source: Department of Commerce, US Census Bureau, Foreign Trade Statistics/USDA FAS/World Trade Organization/news wires


Note: All data is January-December except for 2011*, which only includes exports from January. HK = Hong Kong
Source: USDA FAS
Further Reading
| - | You can view the full report by clicking here. |


