

CME: Increase in Meat and Poultry Inventory
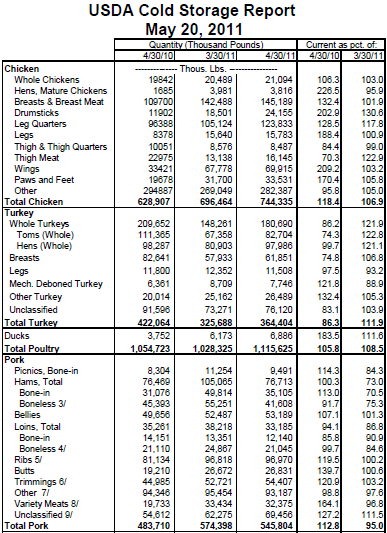
US - To facilitate discussion of Friday's USDA Cold Storage report, Steve Meyer and Len Steiner have studied the table of inventory data for meat and poultry.

Seeing a 9.9 per cent increase in total meat and poultry inventory and three of the four species with double-digit year-on-year increases in freezer inventories provides some reason for pause as we look at recent markets. But readers need to remember that these year-on-year comparisons are being made against some of the lowest meat and poultry inventory numbers in many years at the end of April 2010. Though 10 per cent higher than last year, the April 30 total supply of frozen meat is only 4.5 per cent larger than the average for total monthly freezer inventories from 1994 to present. Large? Yes. Alarmingly large? No.
Frozen chicken inventories grew by the most in unit terms, year-on-year, at +115 million pounds. Every chicken product except thighs/thigh quarters, thigh meat and “other chicken” increased relative to last year with large increases being seen in stocks of breasts/ breast meat, leg quarters and wings. The total of all leg quarter products in freezers was 26 per cent higher than last year and 17 per cent higher than at the end of March, indicating that exports are still somewhat of a challenge. Leg quarter prices have rallied in recent weeks, primarily on the strength of business with Mexico. The build-up of wings in freezers and continued low price of this product (about $0.80/lb. this year versus $1.20 last year and a 5-year average of about $1.00) tells us that, though clearly better, the foodservice sector still has some struggles.
Ham inventories fell sharply, as expected, during April as stocks moved to retail in preparation for the very late Easter holiday this year. The difference in that holiday makes the April year-on-year comparisons for hams about as perilous as were the March year-on-year comparisons so we won’t dwell on those numbers. The two cuts with the largest year-on-year percentage increases were butts and variety meats — both key export items with the recent surge of shipments to Korea. Higher freezer stocks were expected as more of these cuts are prepared for export.
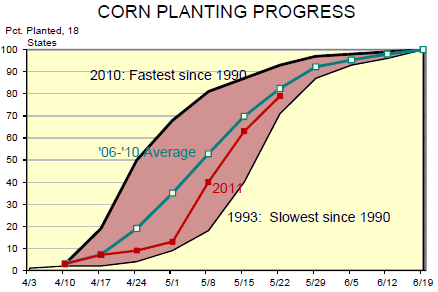
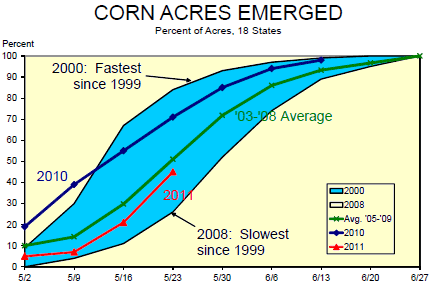
US corn producers again gained on the long-term average for planting progress last week but remain behind their normal pace for this time of year. The charts at right show percentages of corn acres planted and corn acres where the plants have emerged. Note that the averages shown in these charts are the actual mathematical averages for the concurrent week numbers in the past. USDA apparently adjusts the averages a bit to extrapolate across differences in actual dates (as opposed to just week numbers) each year. 79 per cent of total corn acres were planted as of Sunday. Iowa growers were virtually done but the eastern Cornbelt is still having difficulties. Only 11 per cent of Ohio’s corn acres were reported planted as of Sunday and the pace was significantly behind in Pennsylvania, Michigan, Indiana and North Dakota as well. Illinois, the second largest corn producing state reached the 90 per cent level this week. That compares to a 5-year average of 85 per cent.


Corn plants have emerged on an estimated 45 per cent of total acres as of Sunday. That compares to USDA’s 5-year average of 59 per cent and 69 per cent one year ago. Corn emergence was ahead of its normal pace in Iowa and Missouri but lagged in virtually every other major state. The most serious lags were, as one would expect, in those same states that have seen difficulties getting corn planted.
How serious is this situation? Worrisome but still not critical in our opinion. 2008 was the slowest emergence year since 1999 and the national average yield that year was 153.9 bushels, 2.3 bushels above the trend yield.


